Clear and attractive infographics
To make a large amount of information like a message or even a story insightful and attractive, an infographic or so-called visual report is often ideal. It is used to clarify objectives, make a process transparent or is used as a starting point for the conversation. For the last couple of years I've made many infographics about various subjects. This is a small selections of the projects I'm proud of.
Information design / illustrations
In employment of Things To Make And Do


Look
I've also made some beautiful infographics as an employee of Tappan

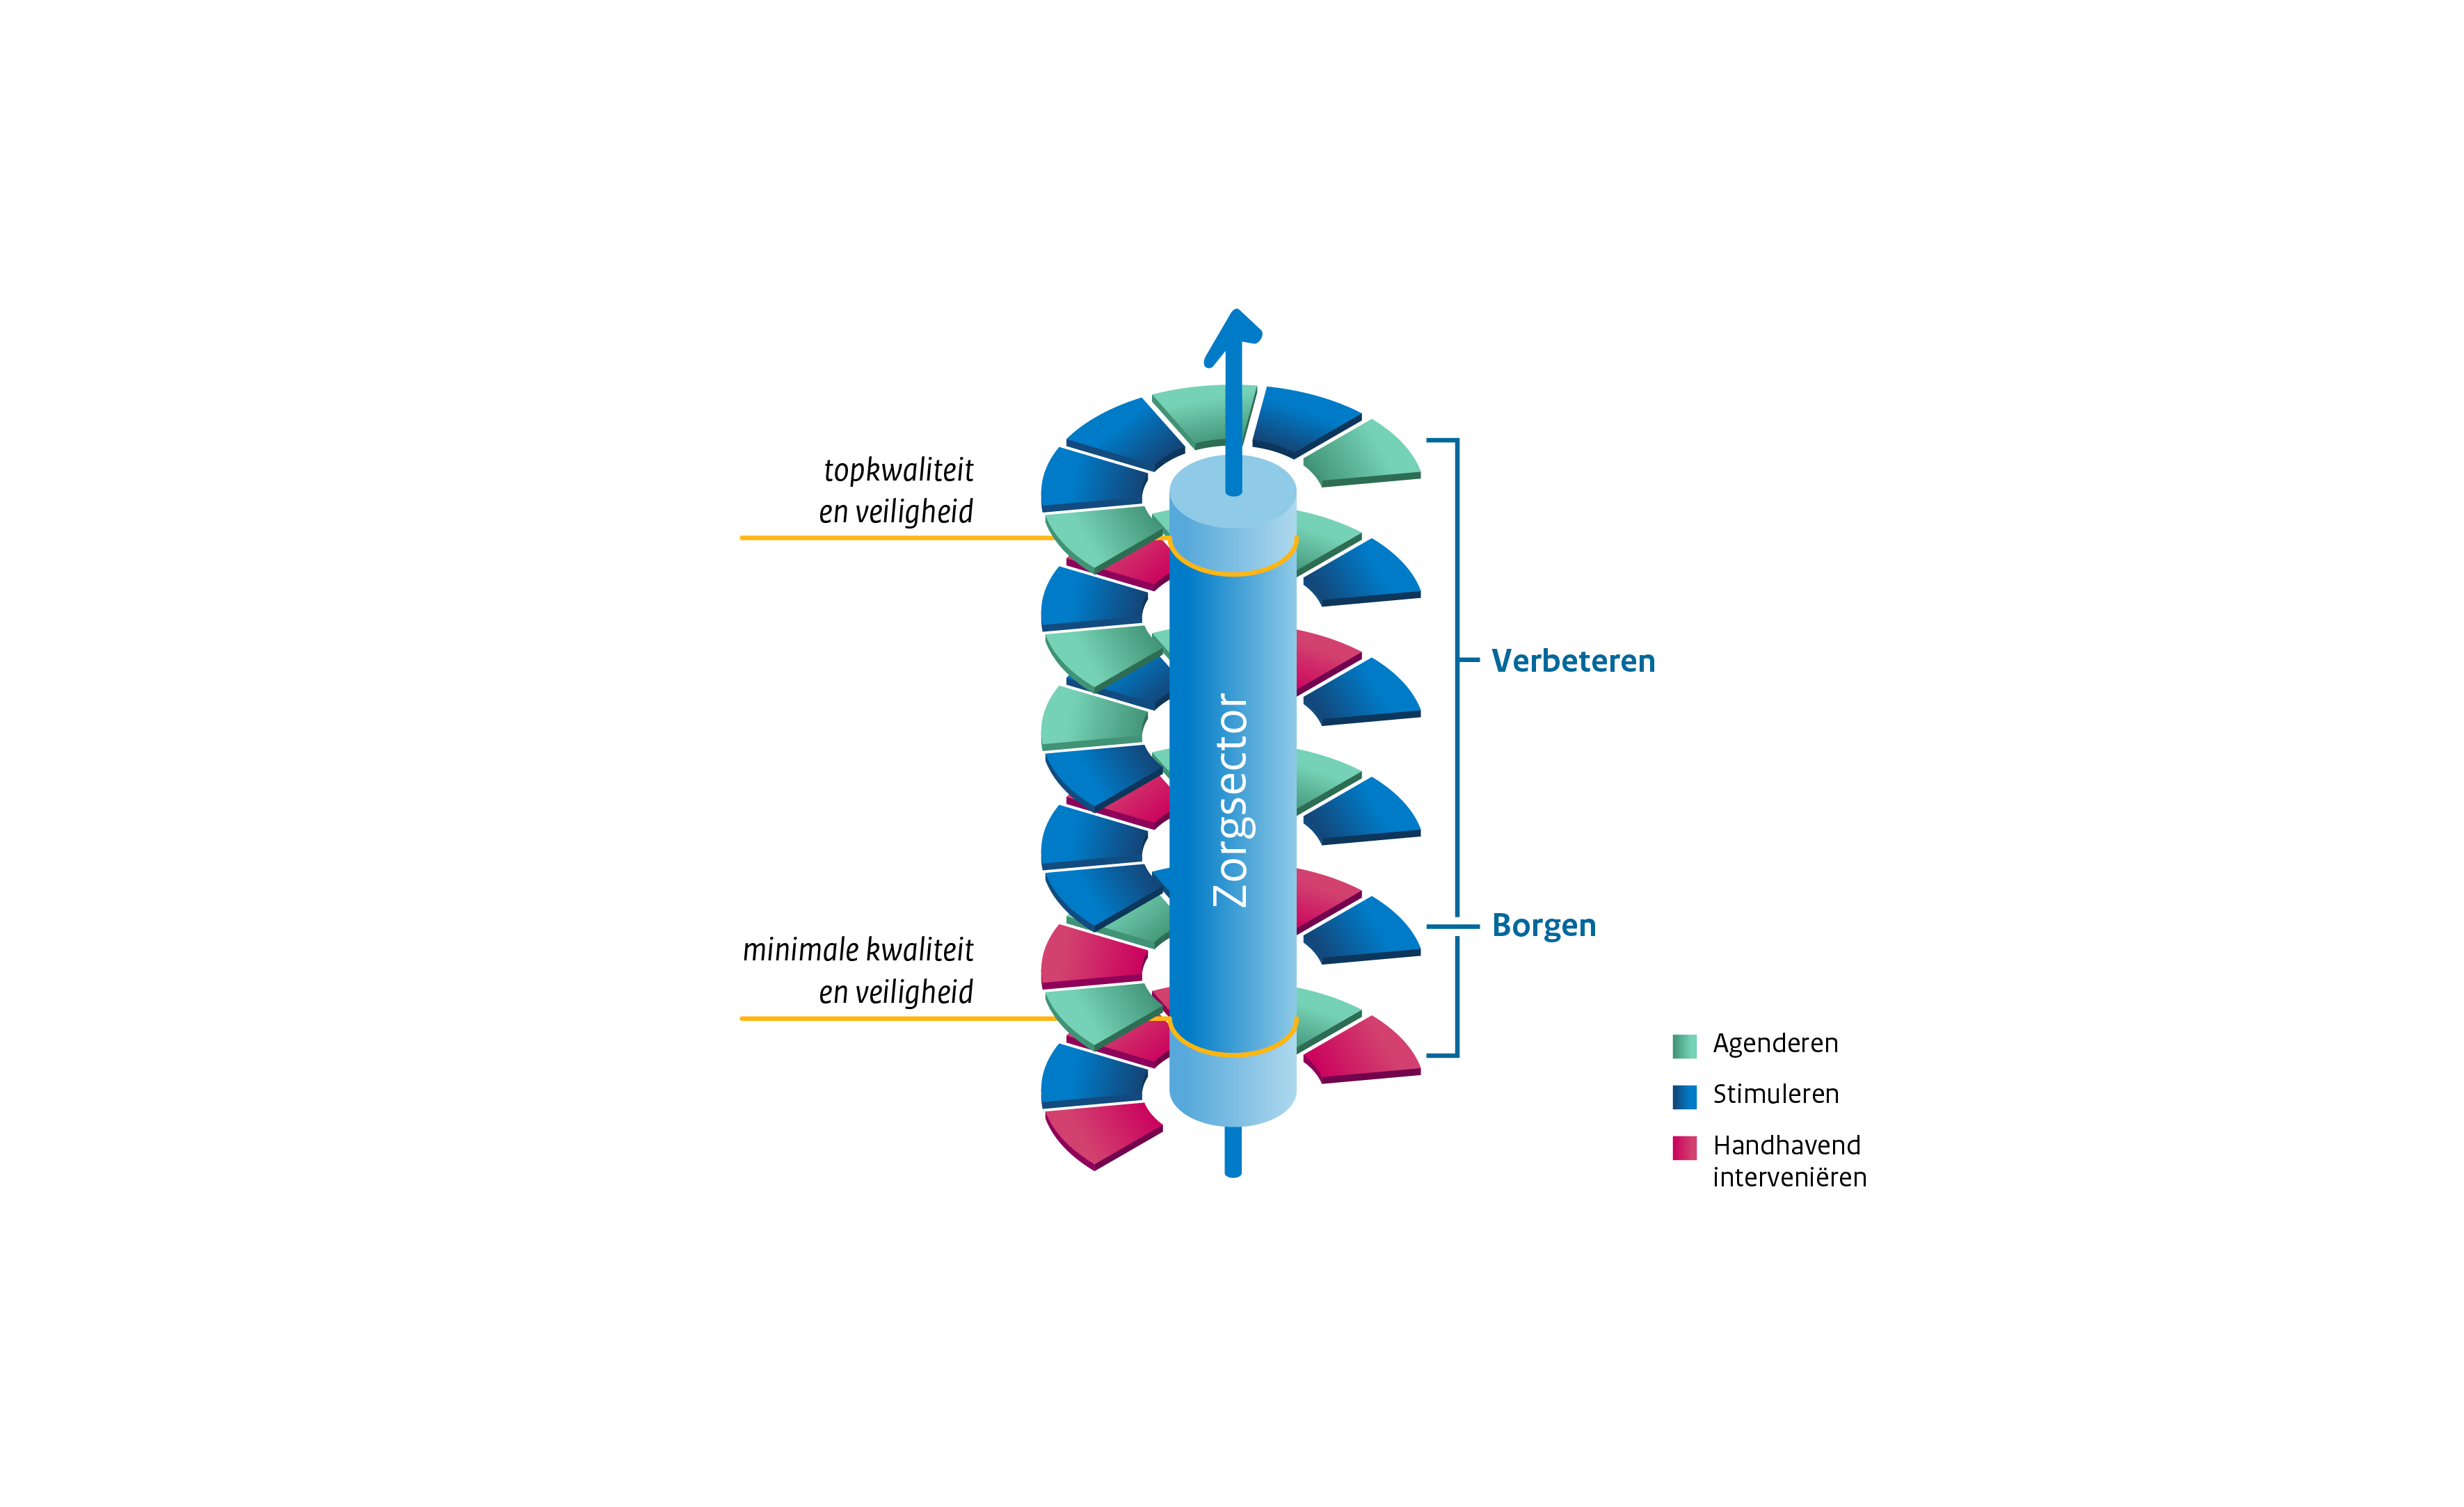
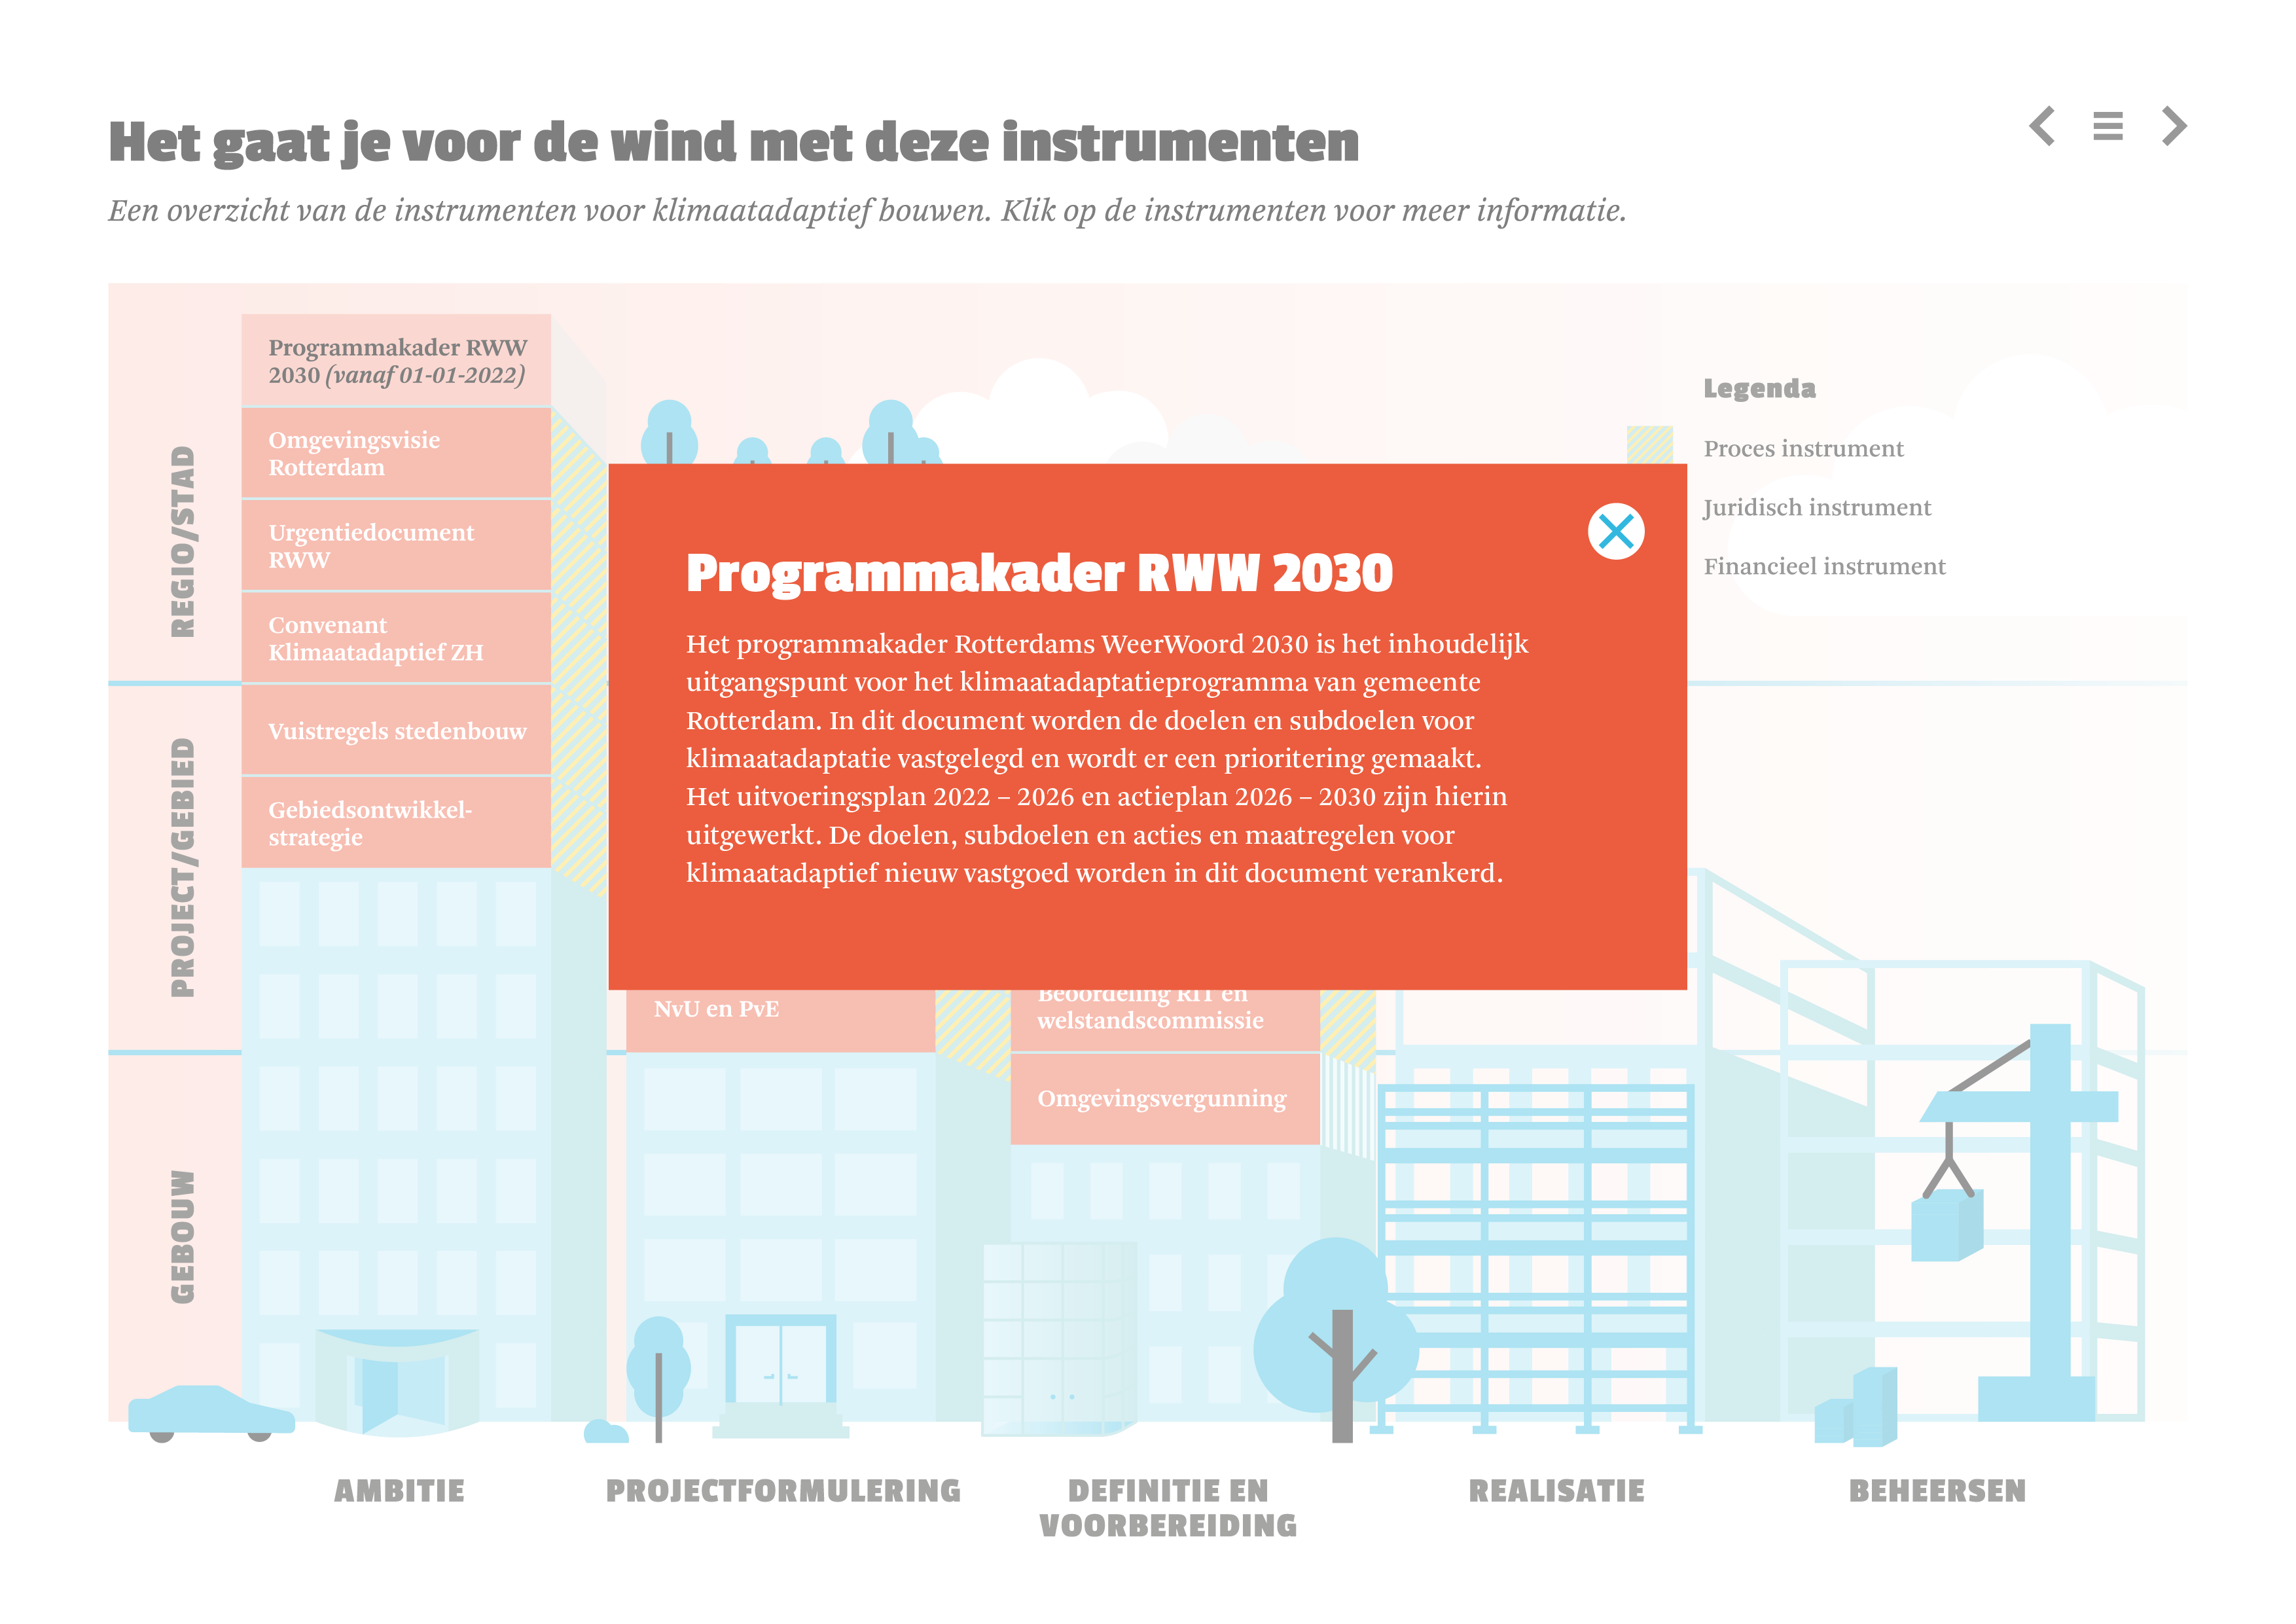
Frameworks and guidelines are needed to streamline large processes. Using the framework process, you efficiently create and manage useful and effective frameworks and guidelines. This visual is a handy overview of the three phases, nine steps and the relevant roles of the framing process.
There's more!
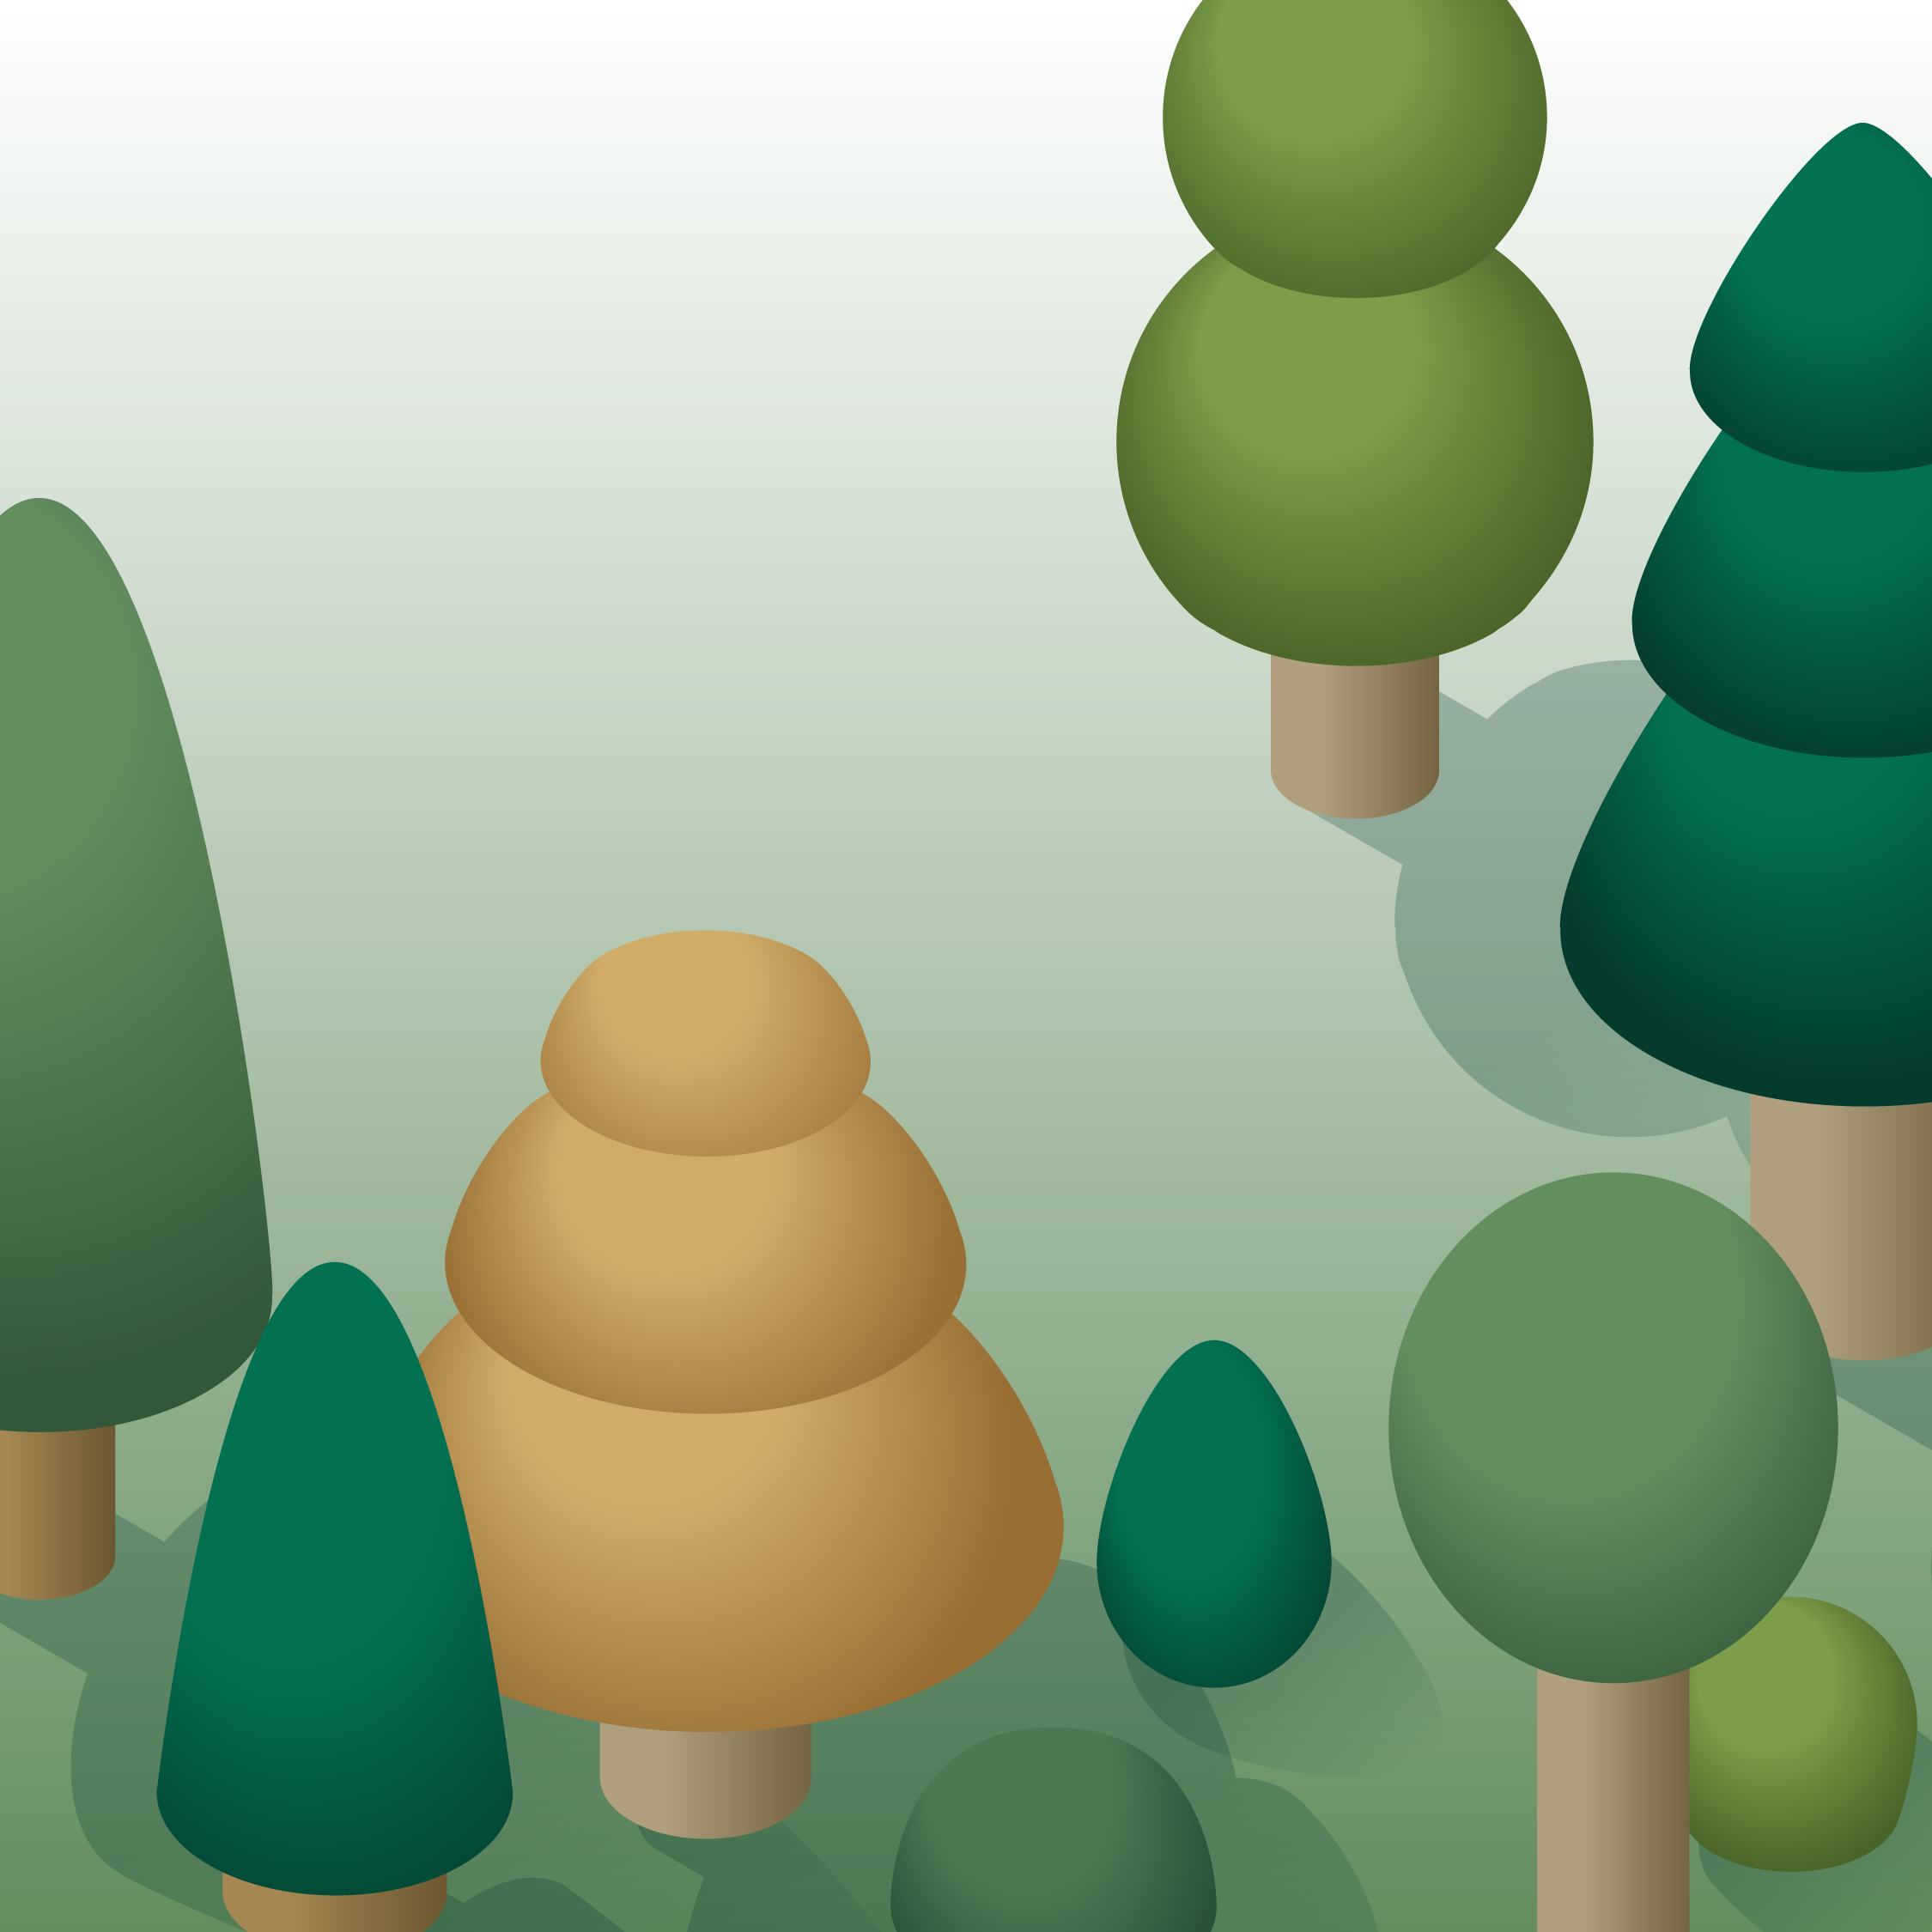
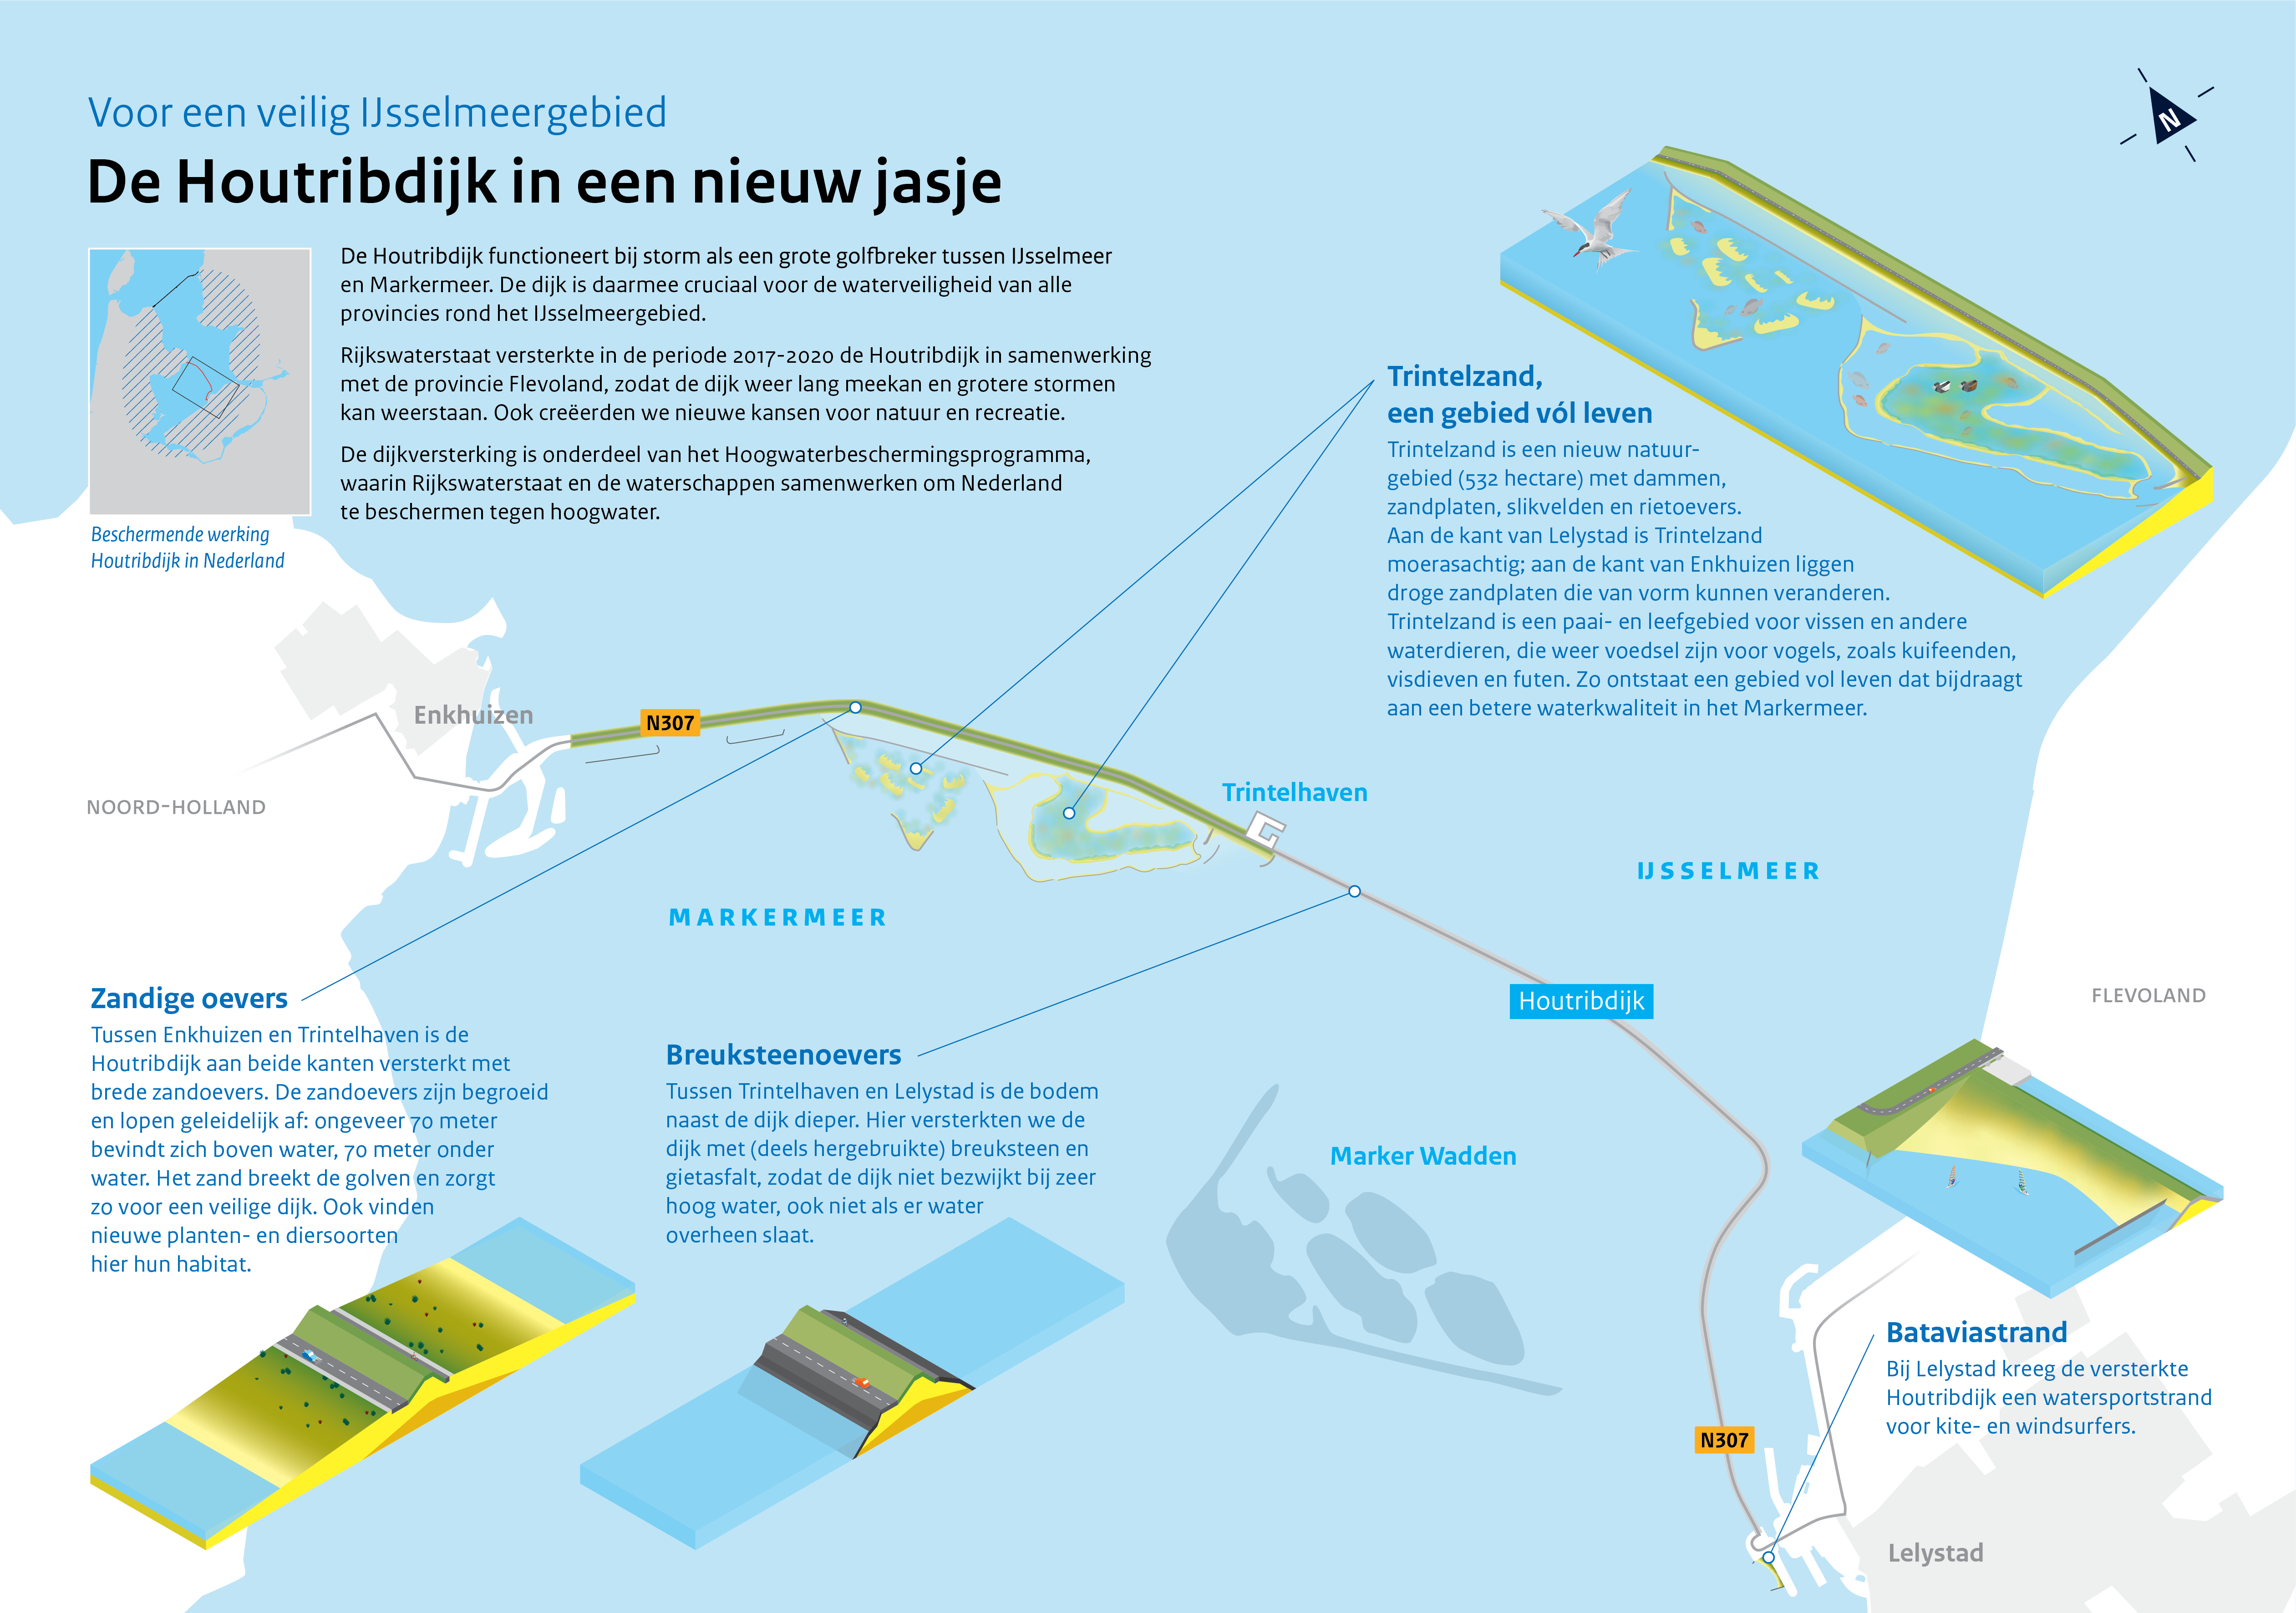
Isometric infographics and illustrations
Set of icons
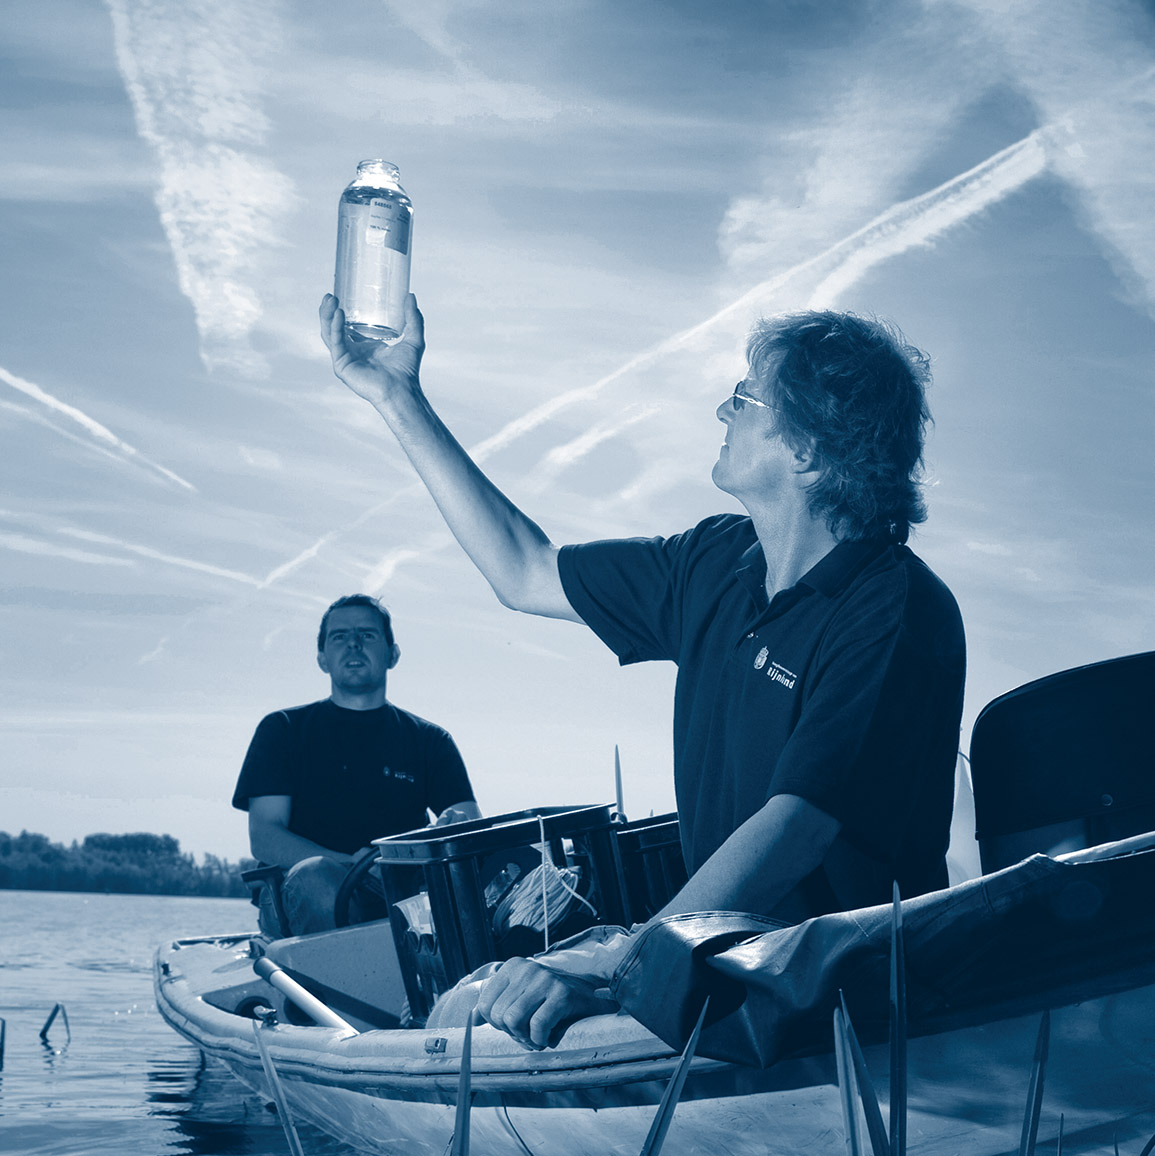
Booklet Rijnland Water District
Your project here? Contact me!
Copyright © Jolien Verduijn 2024