Isometric infographics and illustrations
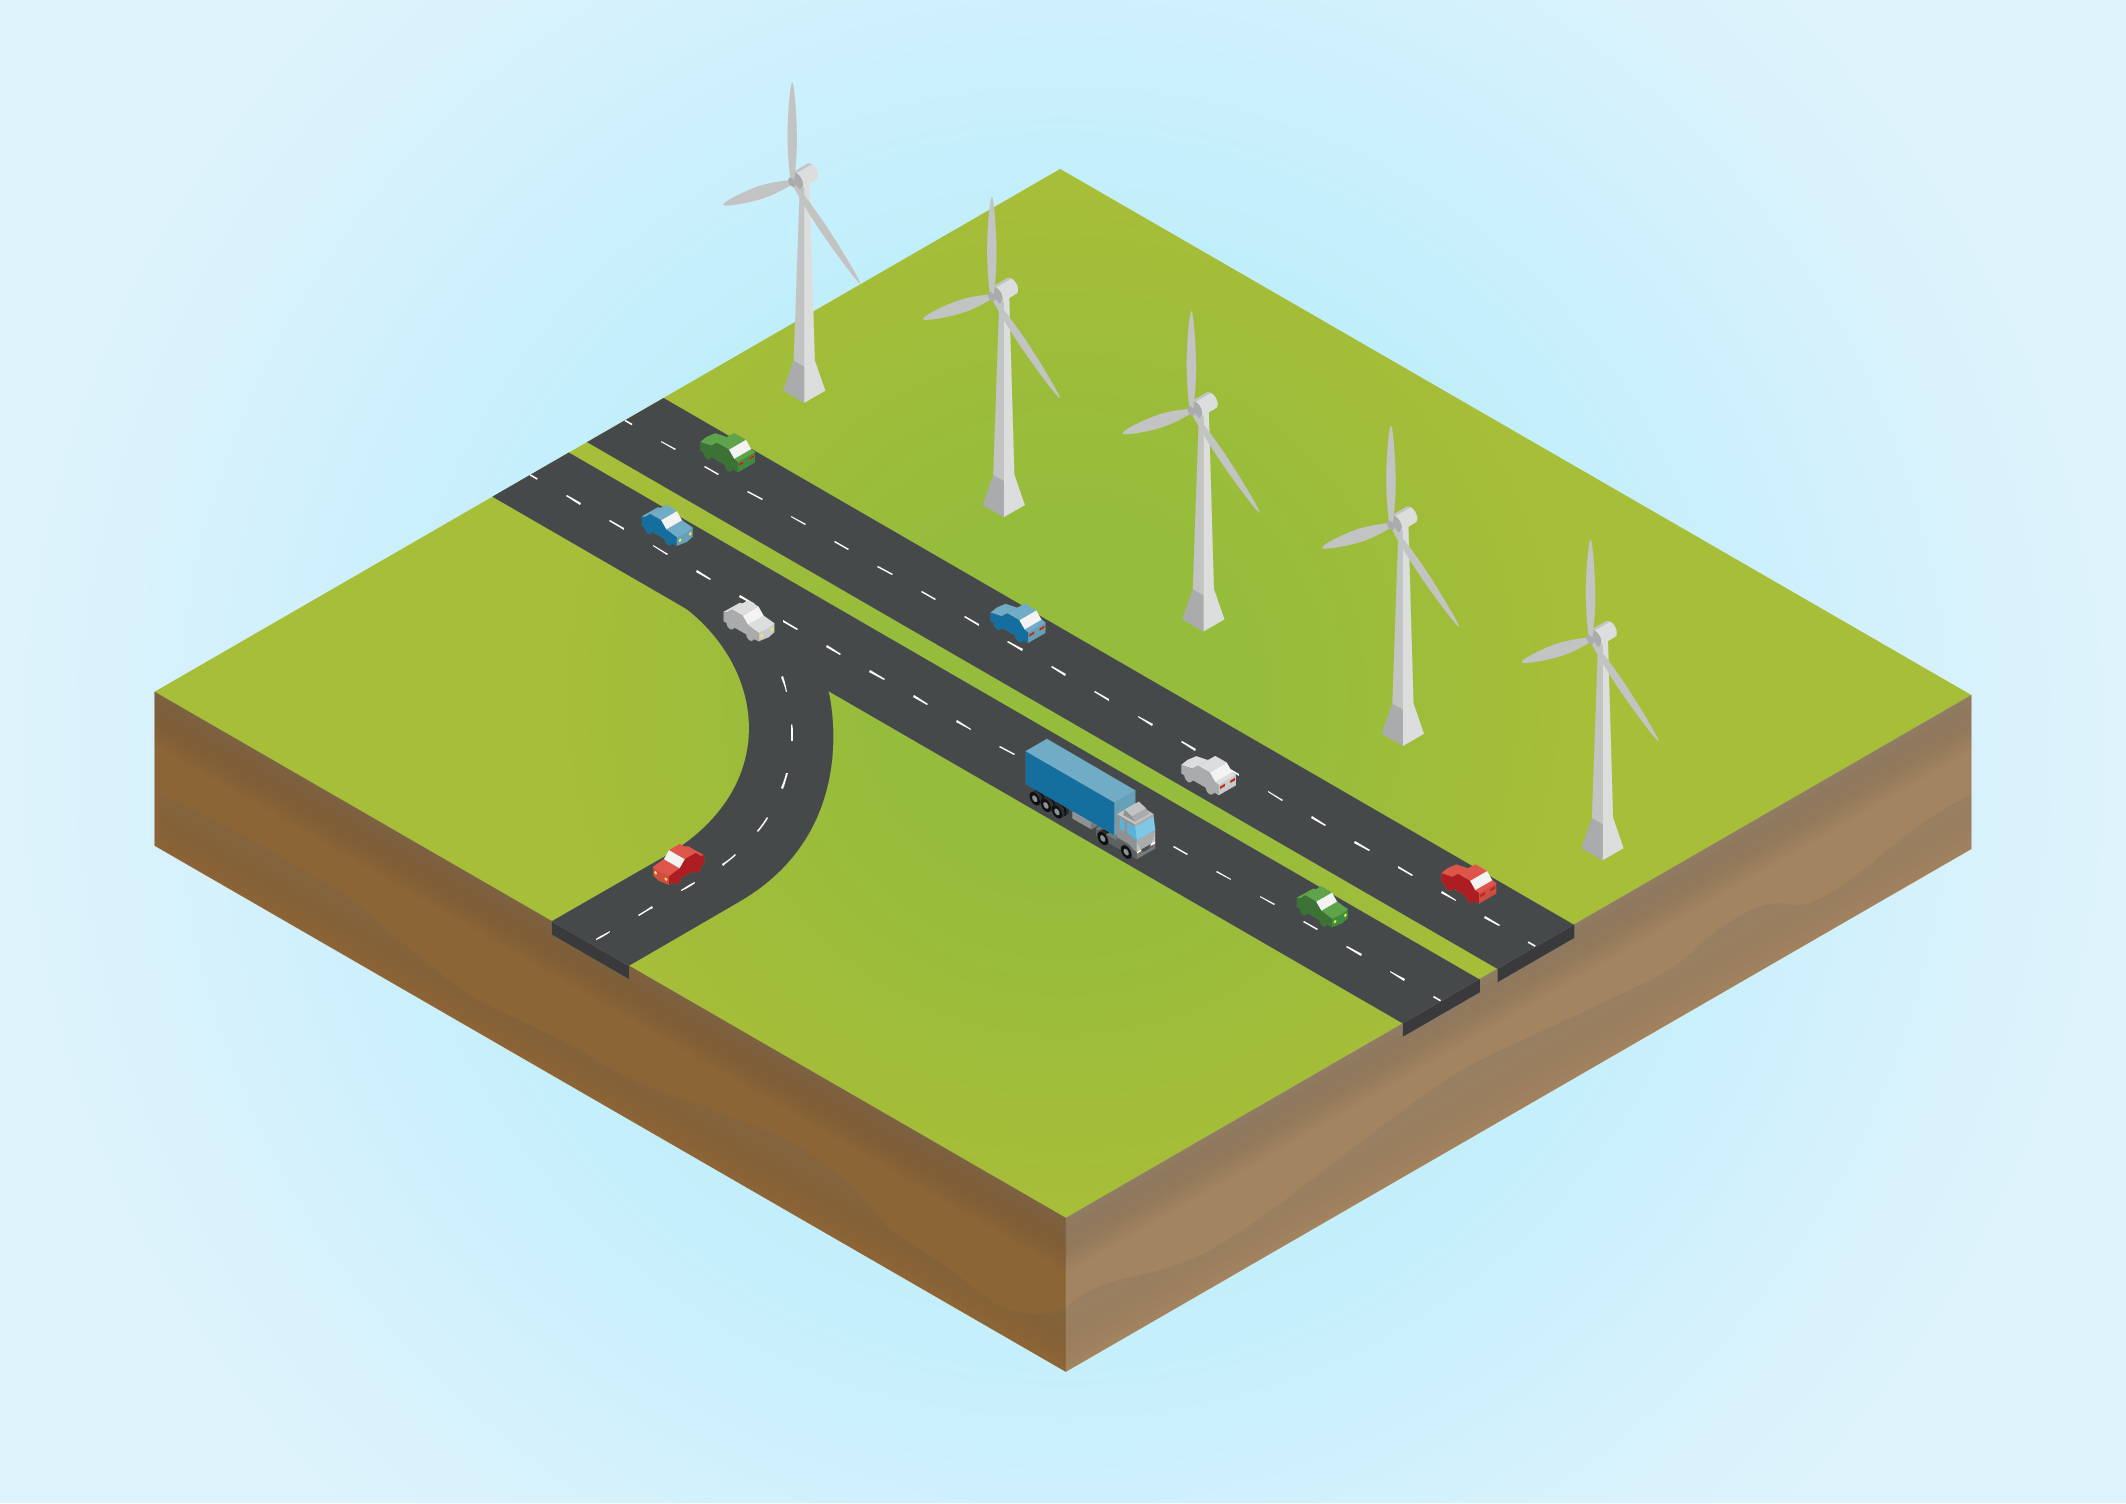
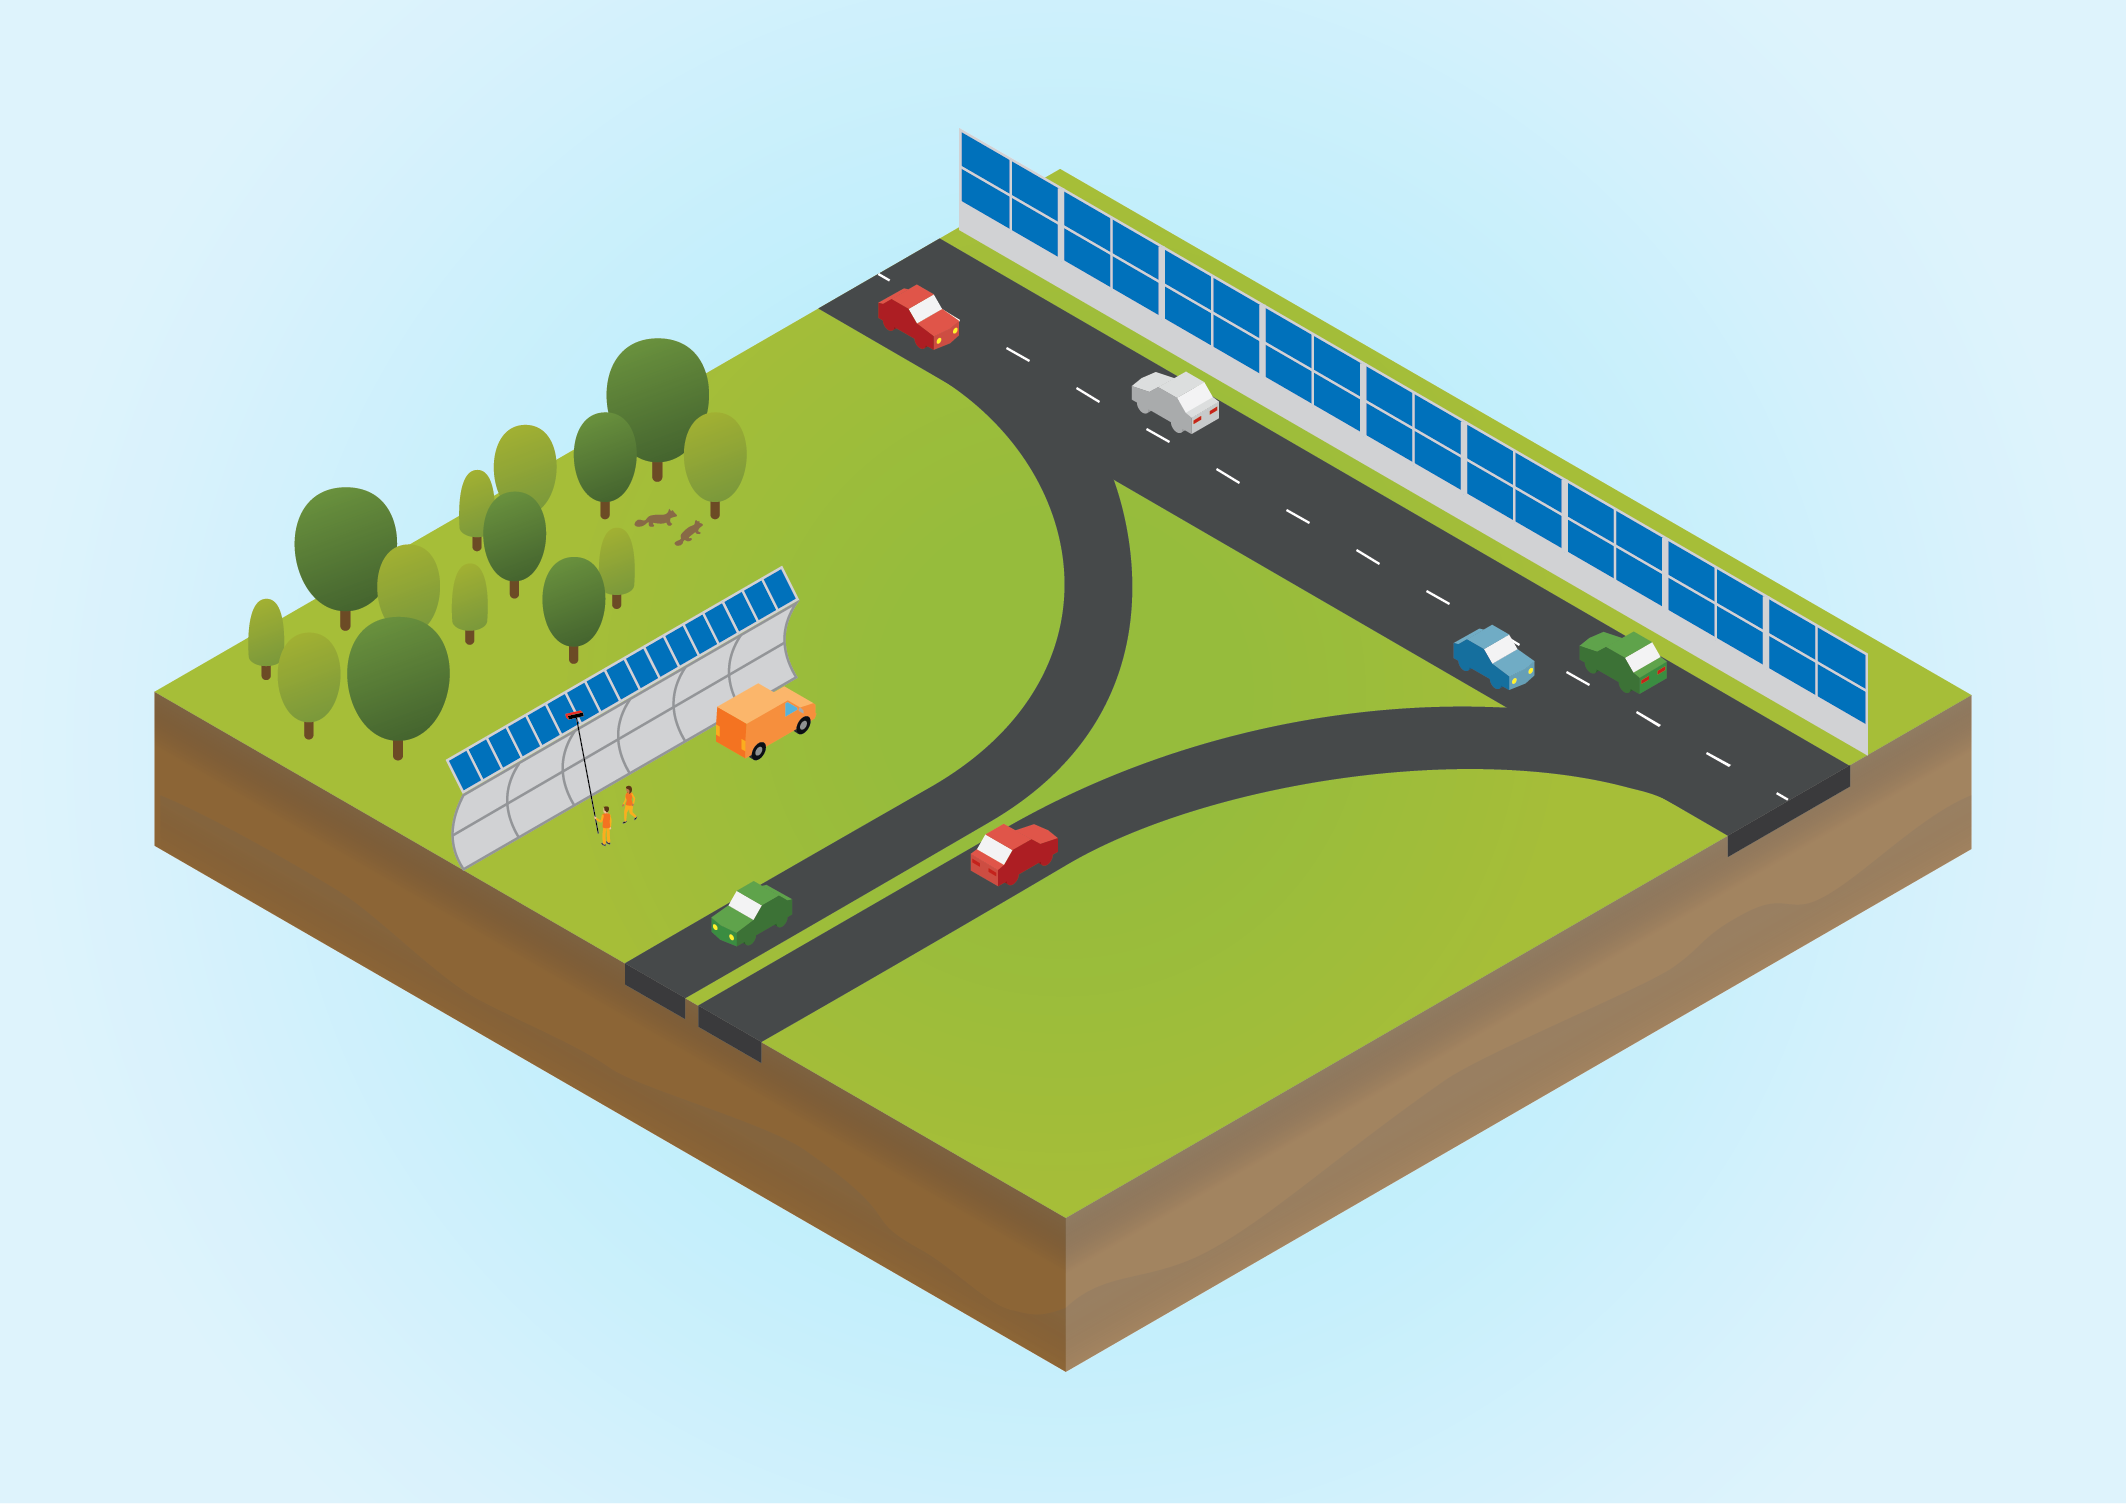
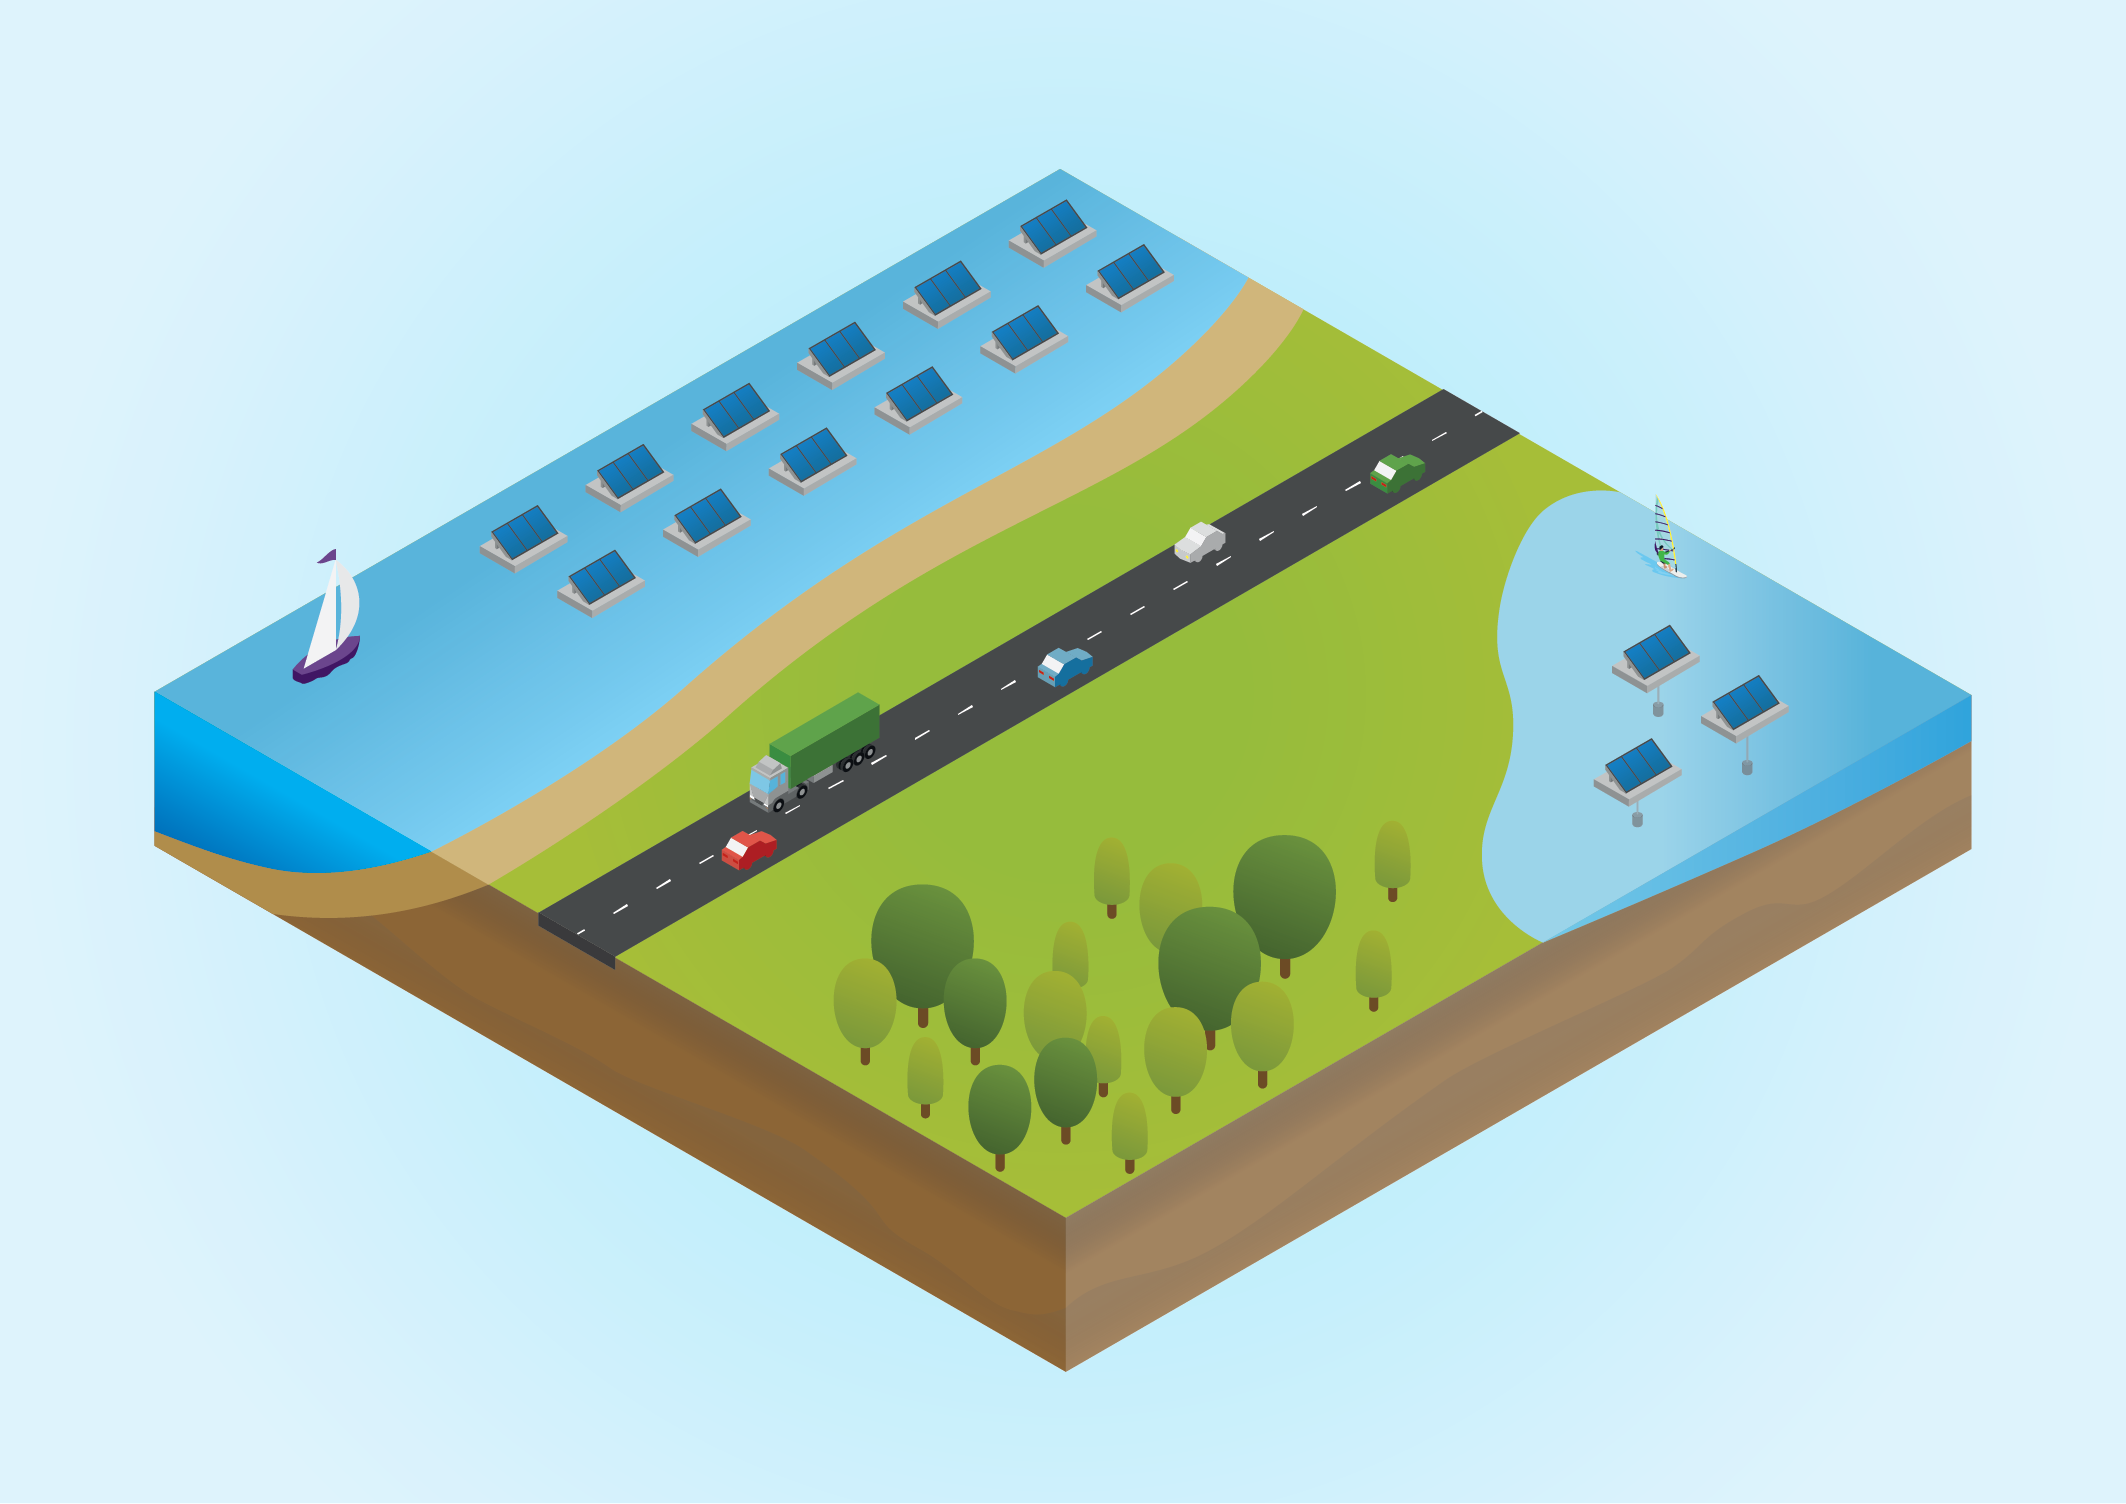
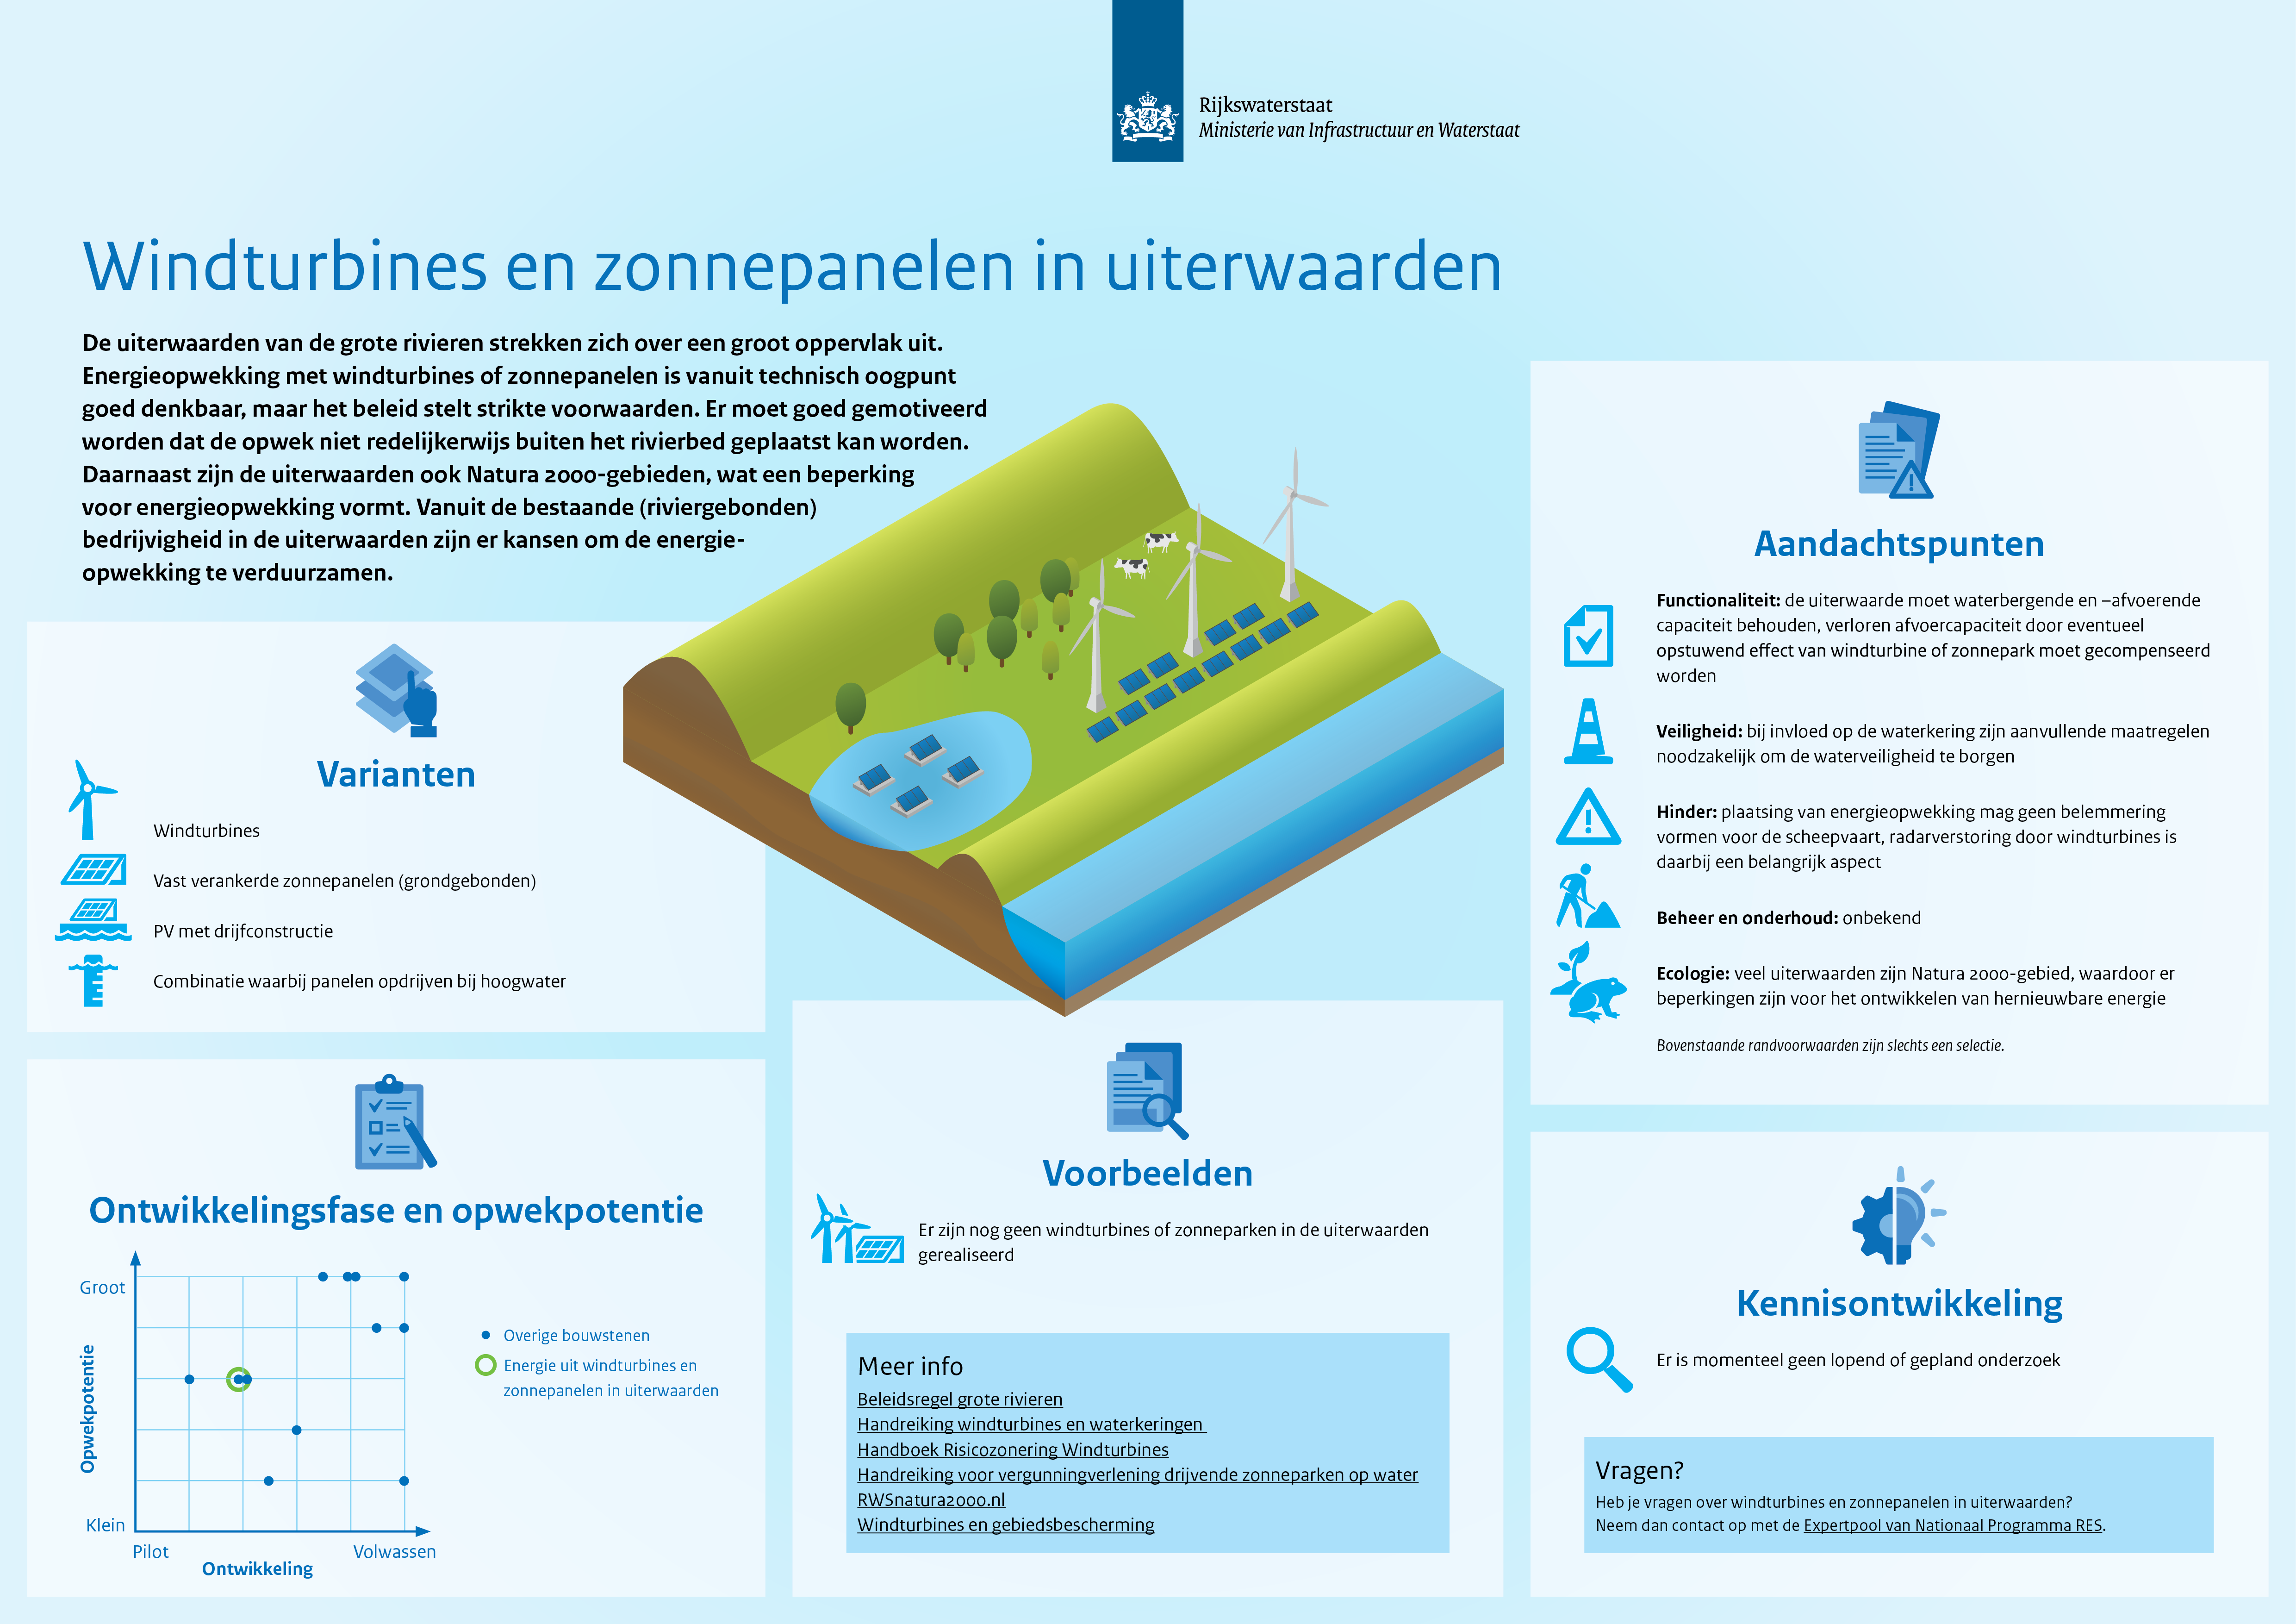
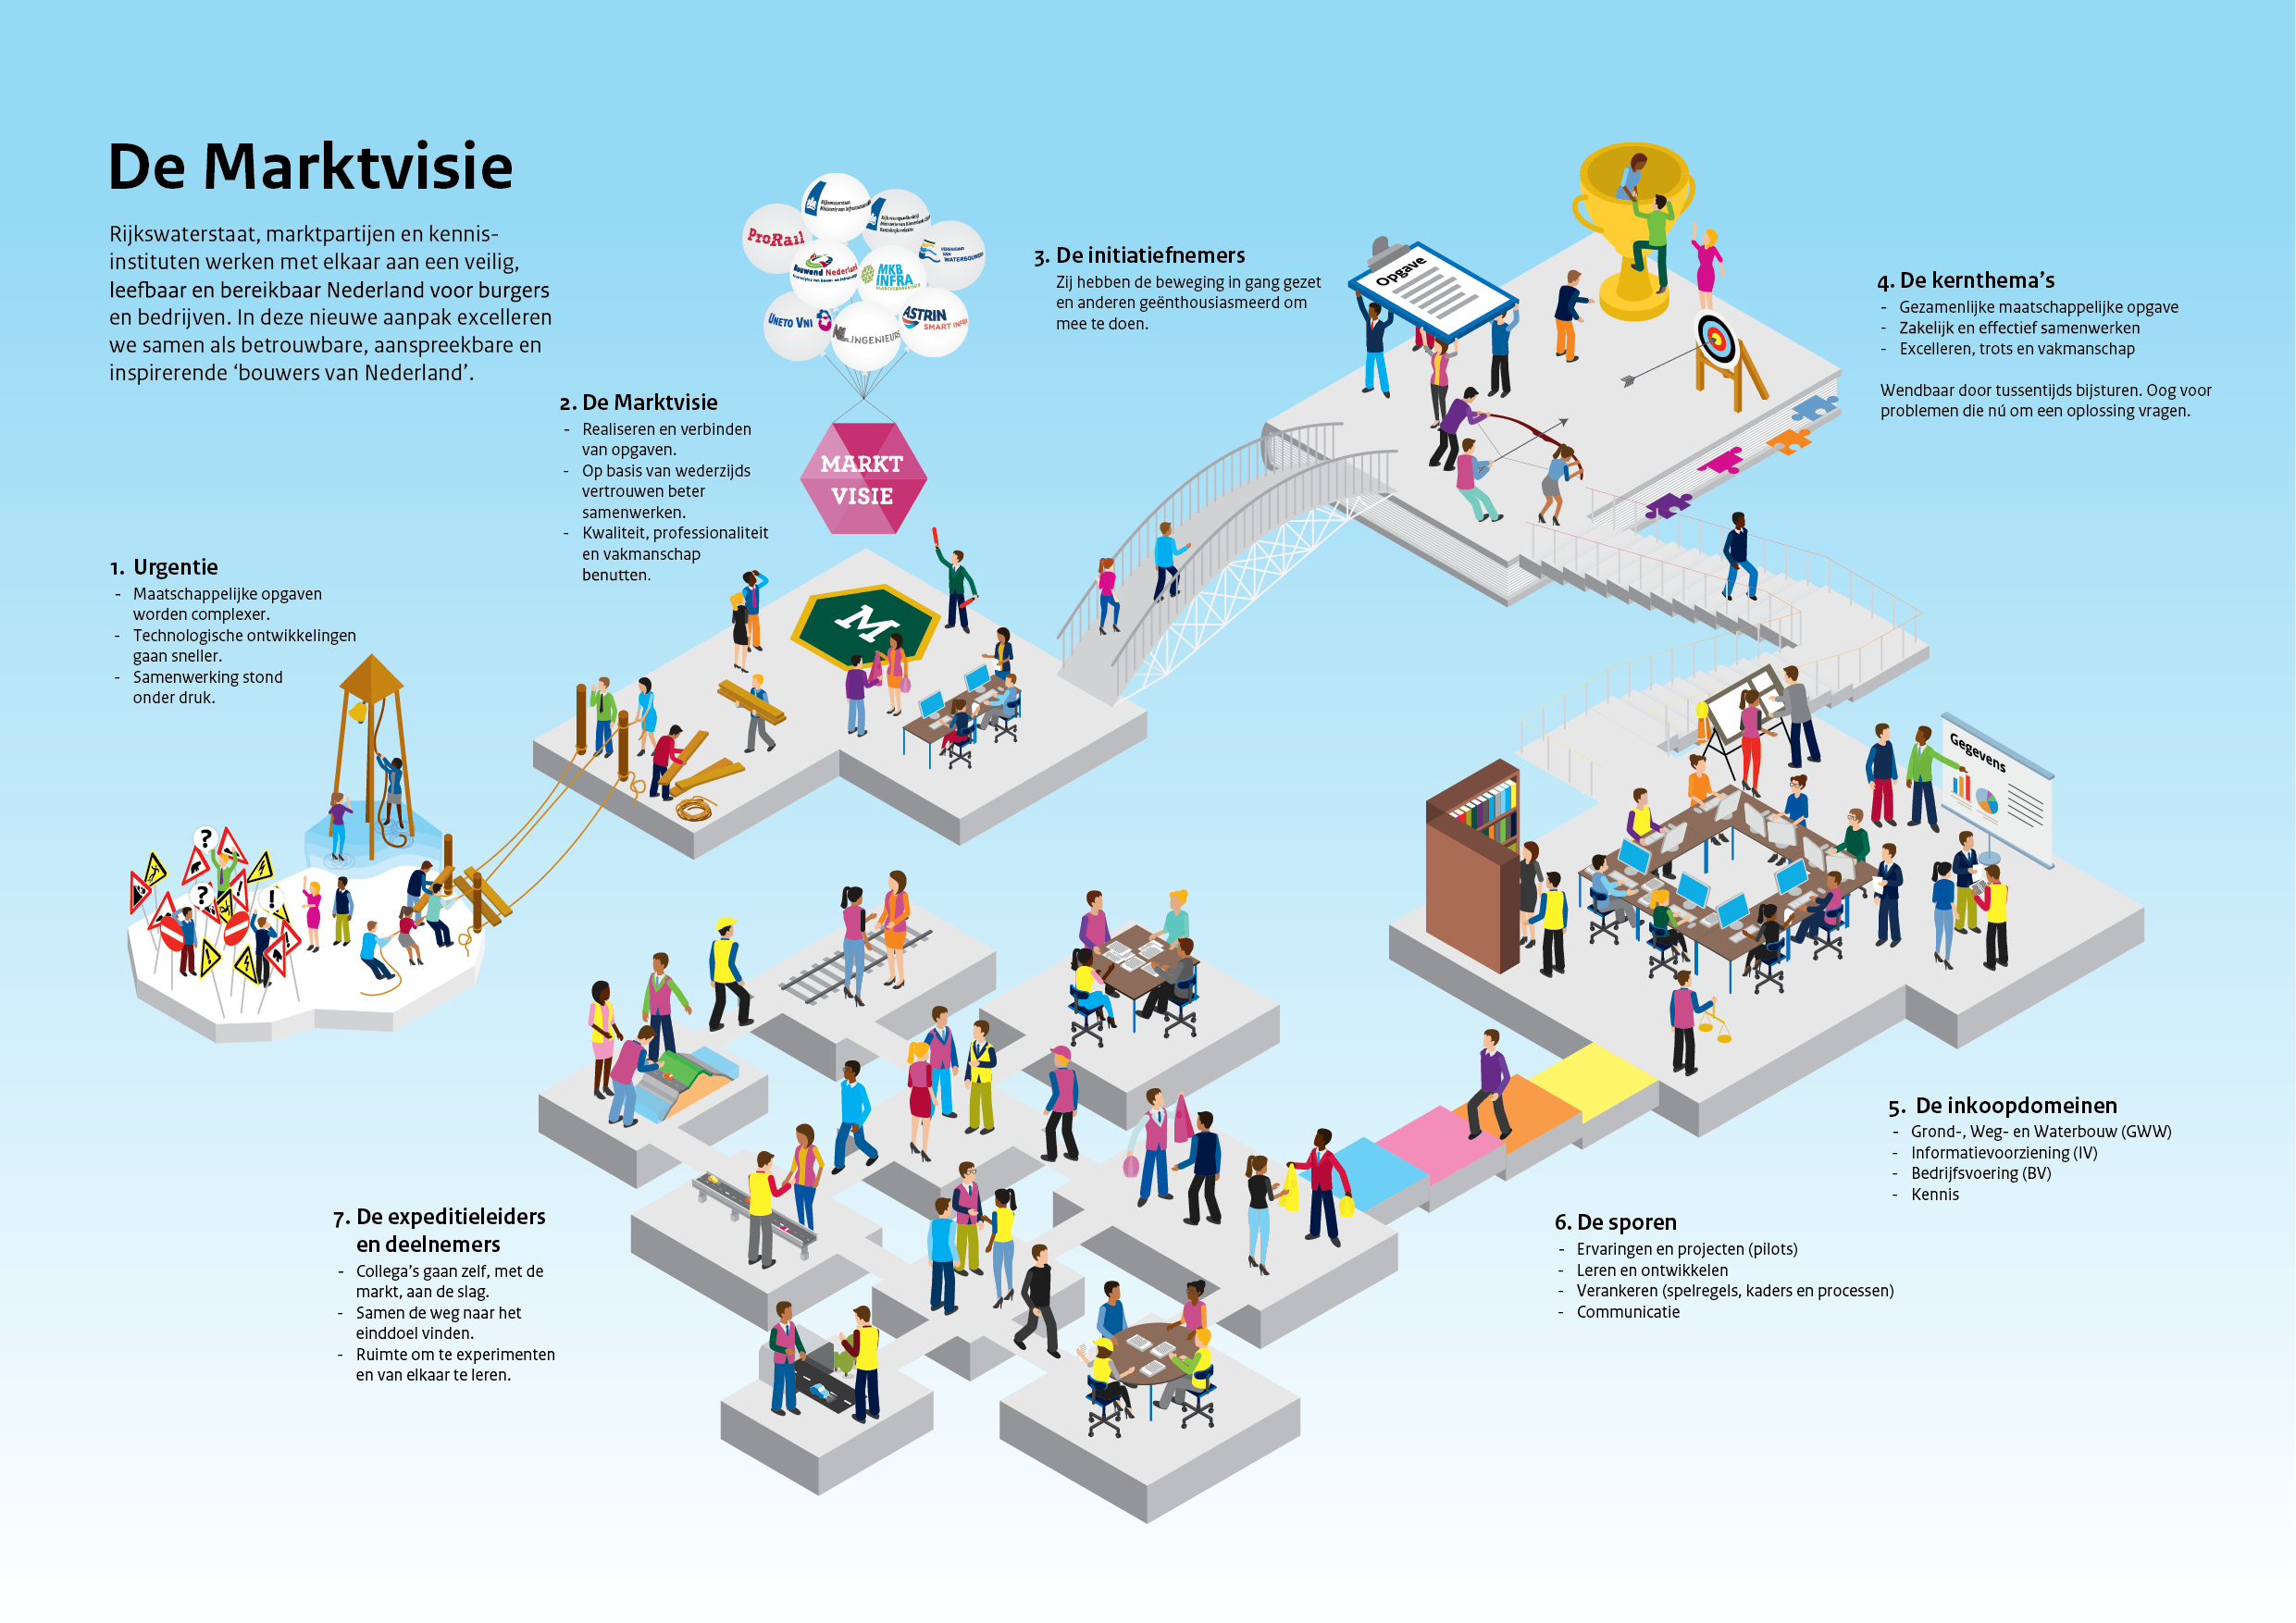
Isometric visuals are created in a two-dimensional way, but they appear three-dimensional. There's no vanishing point because all the axes' angles in the drawing are equal. These type of illustrations works very well when a large amount of information needs to be visualized.
Information design / illustration
In employment of Things To Make And Do

Keep scrolling
Here are some isometric infographics and illustrations I made in employment of Tappan


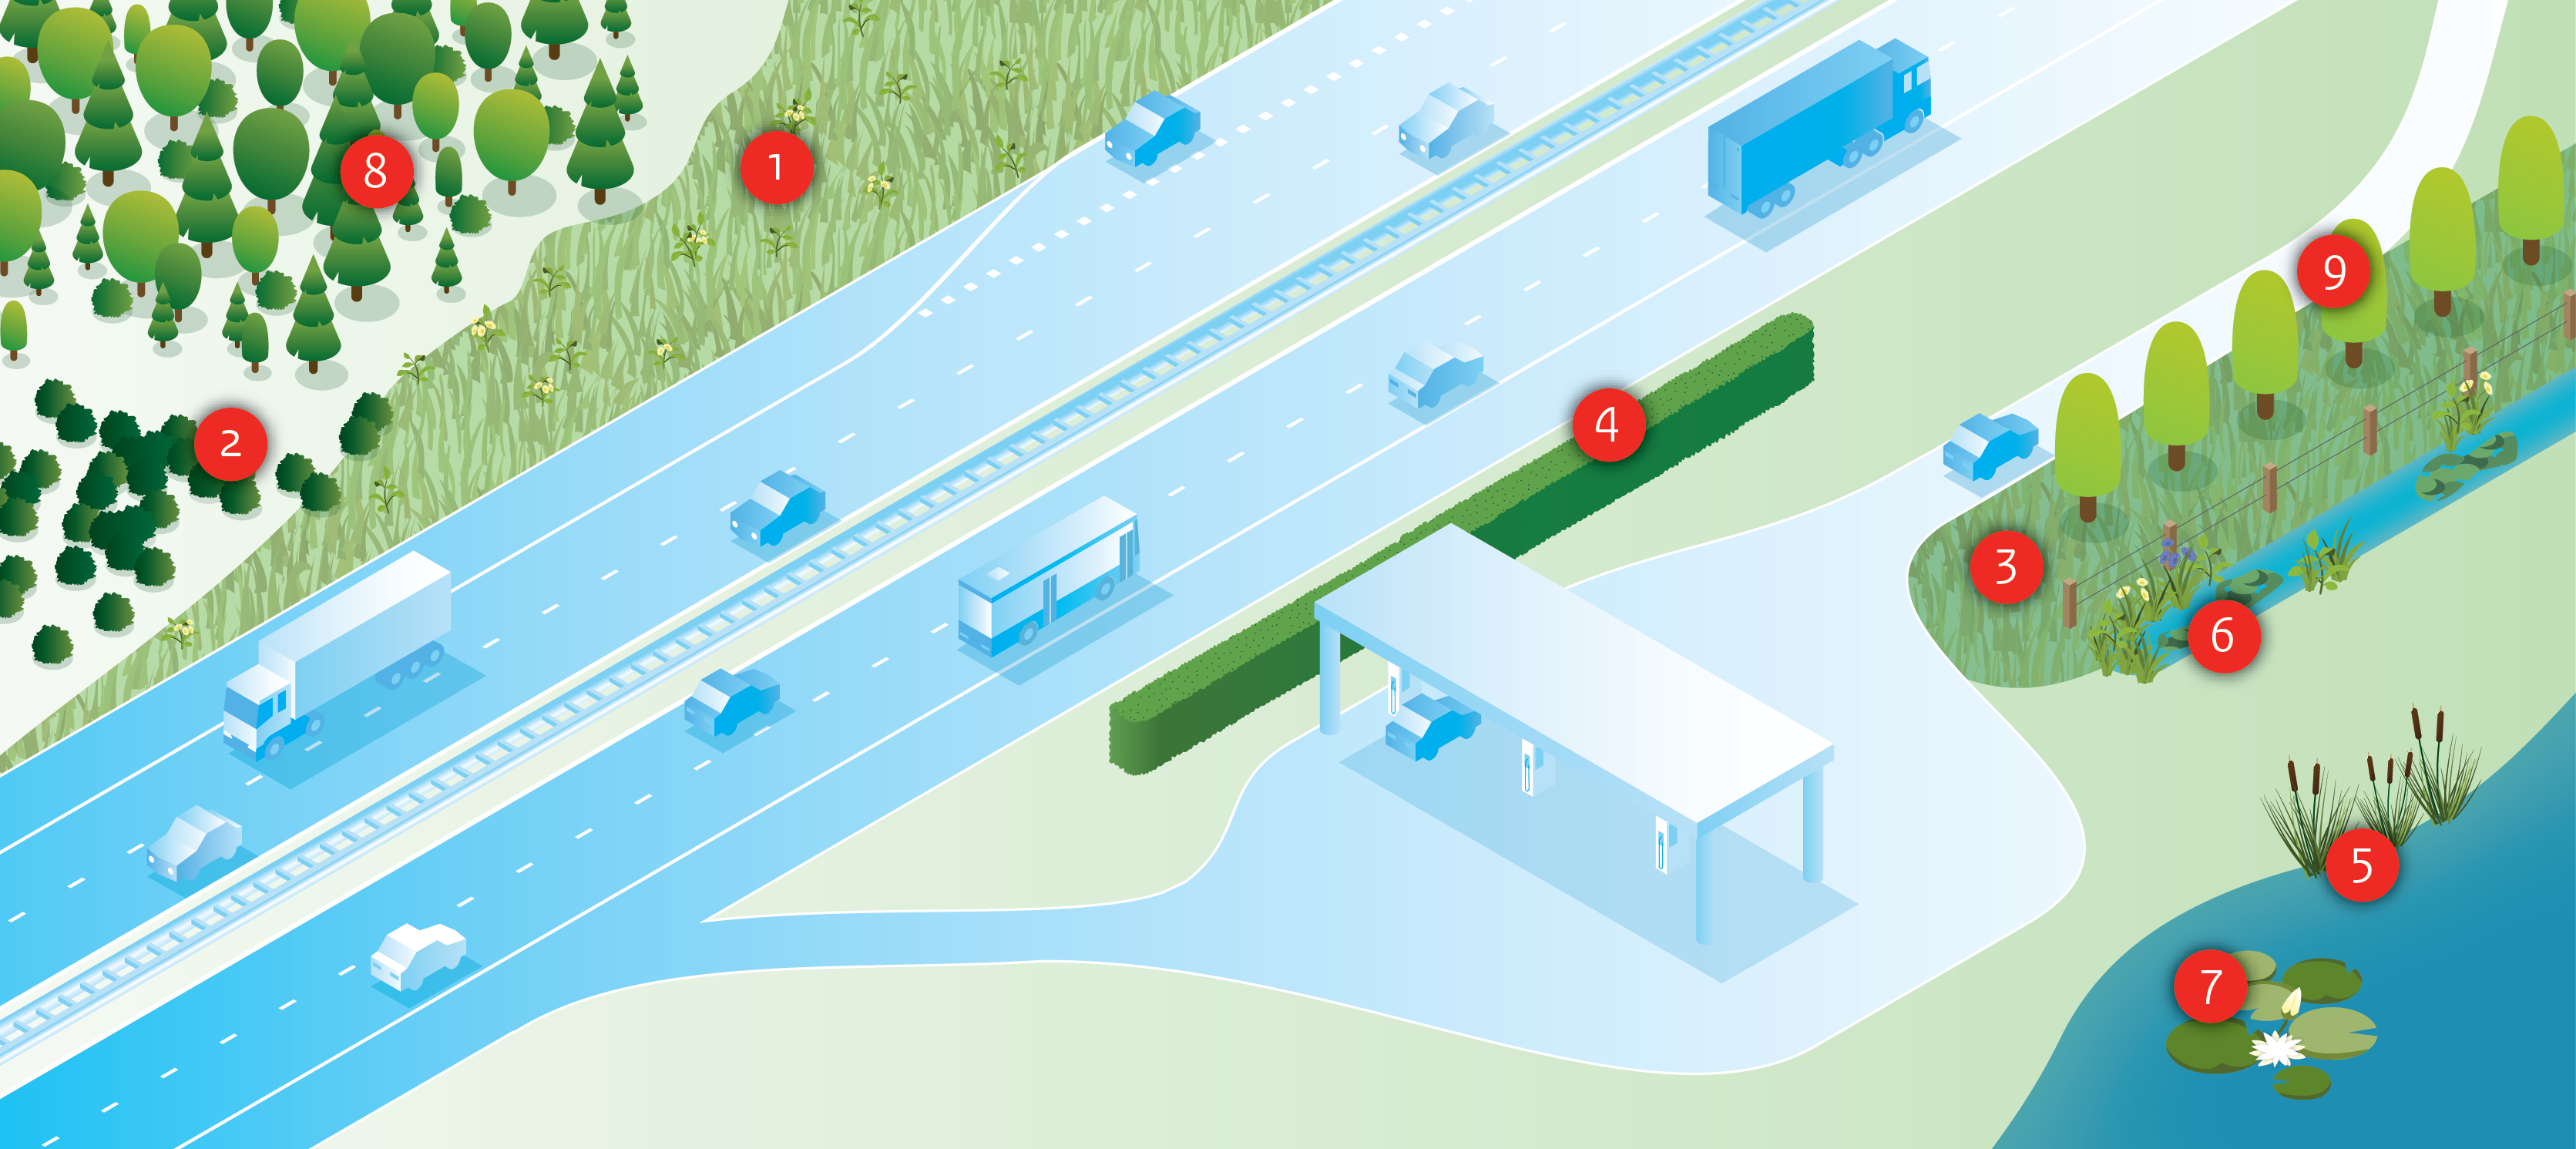

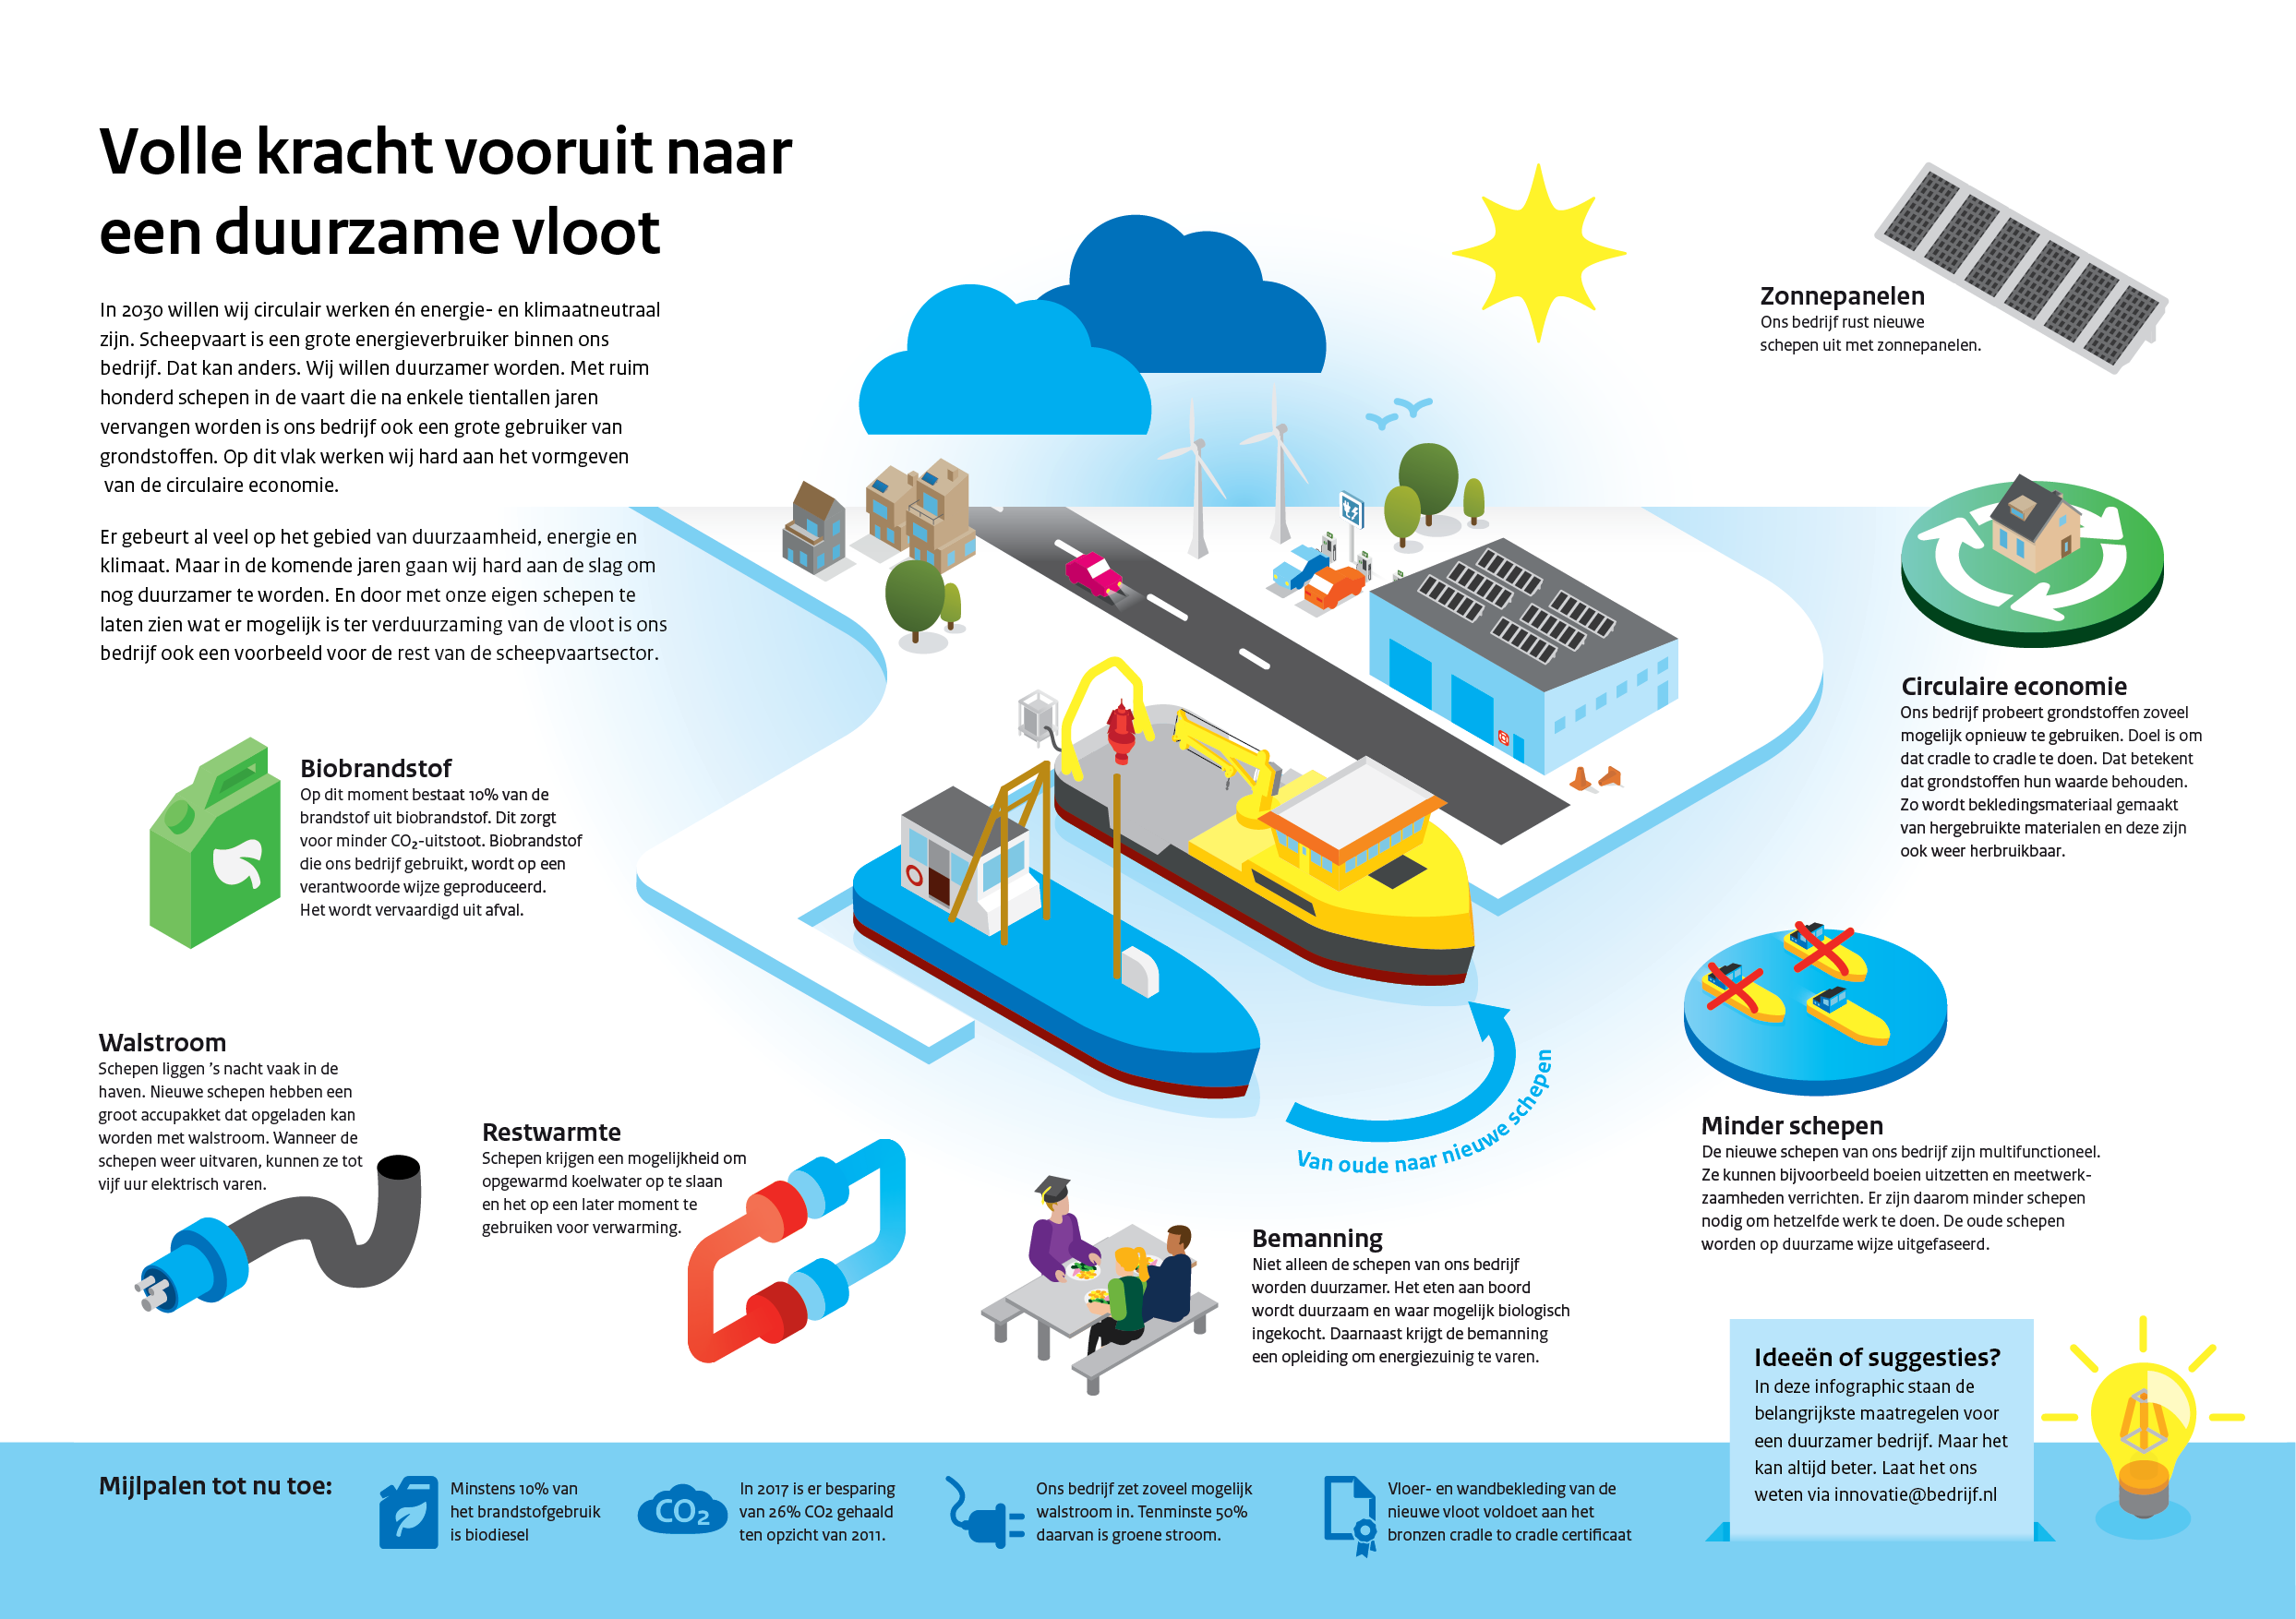


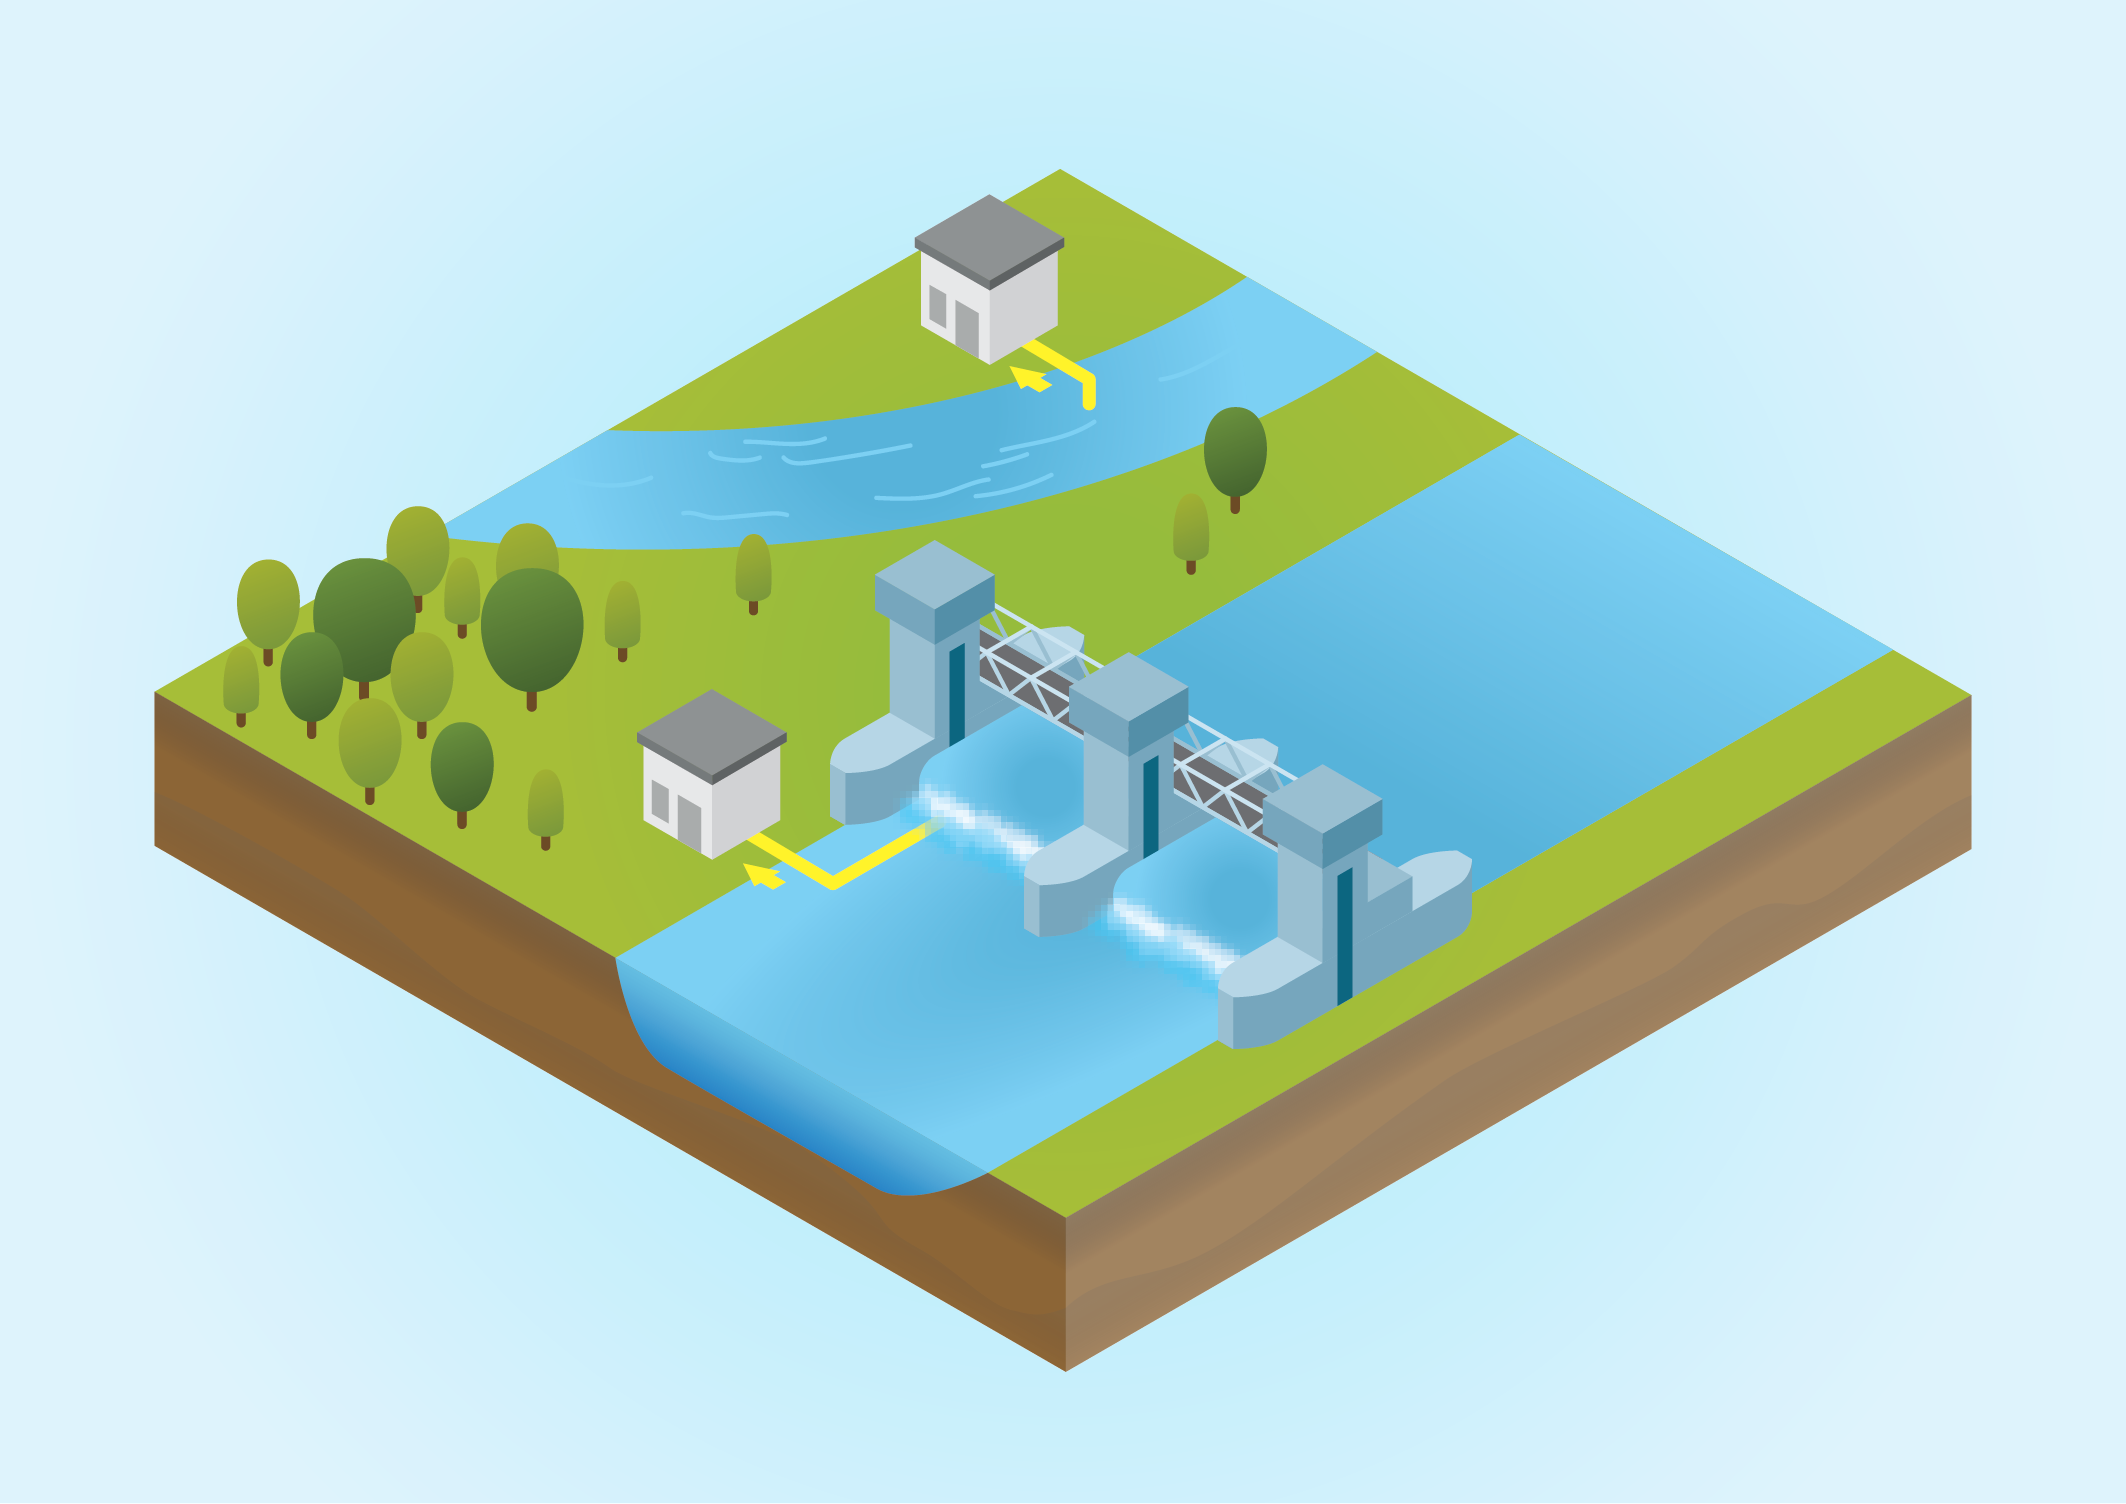

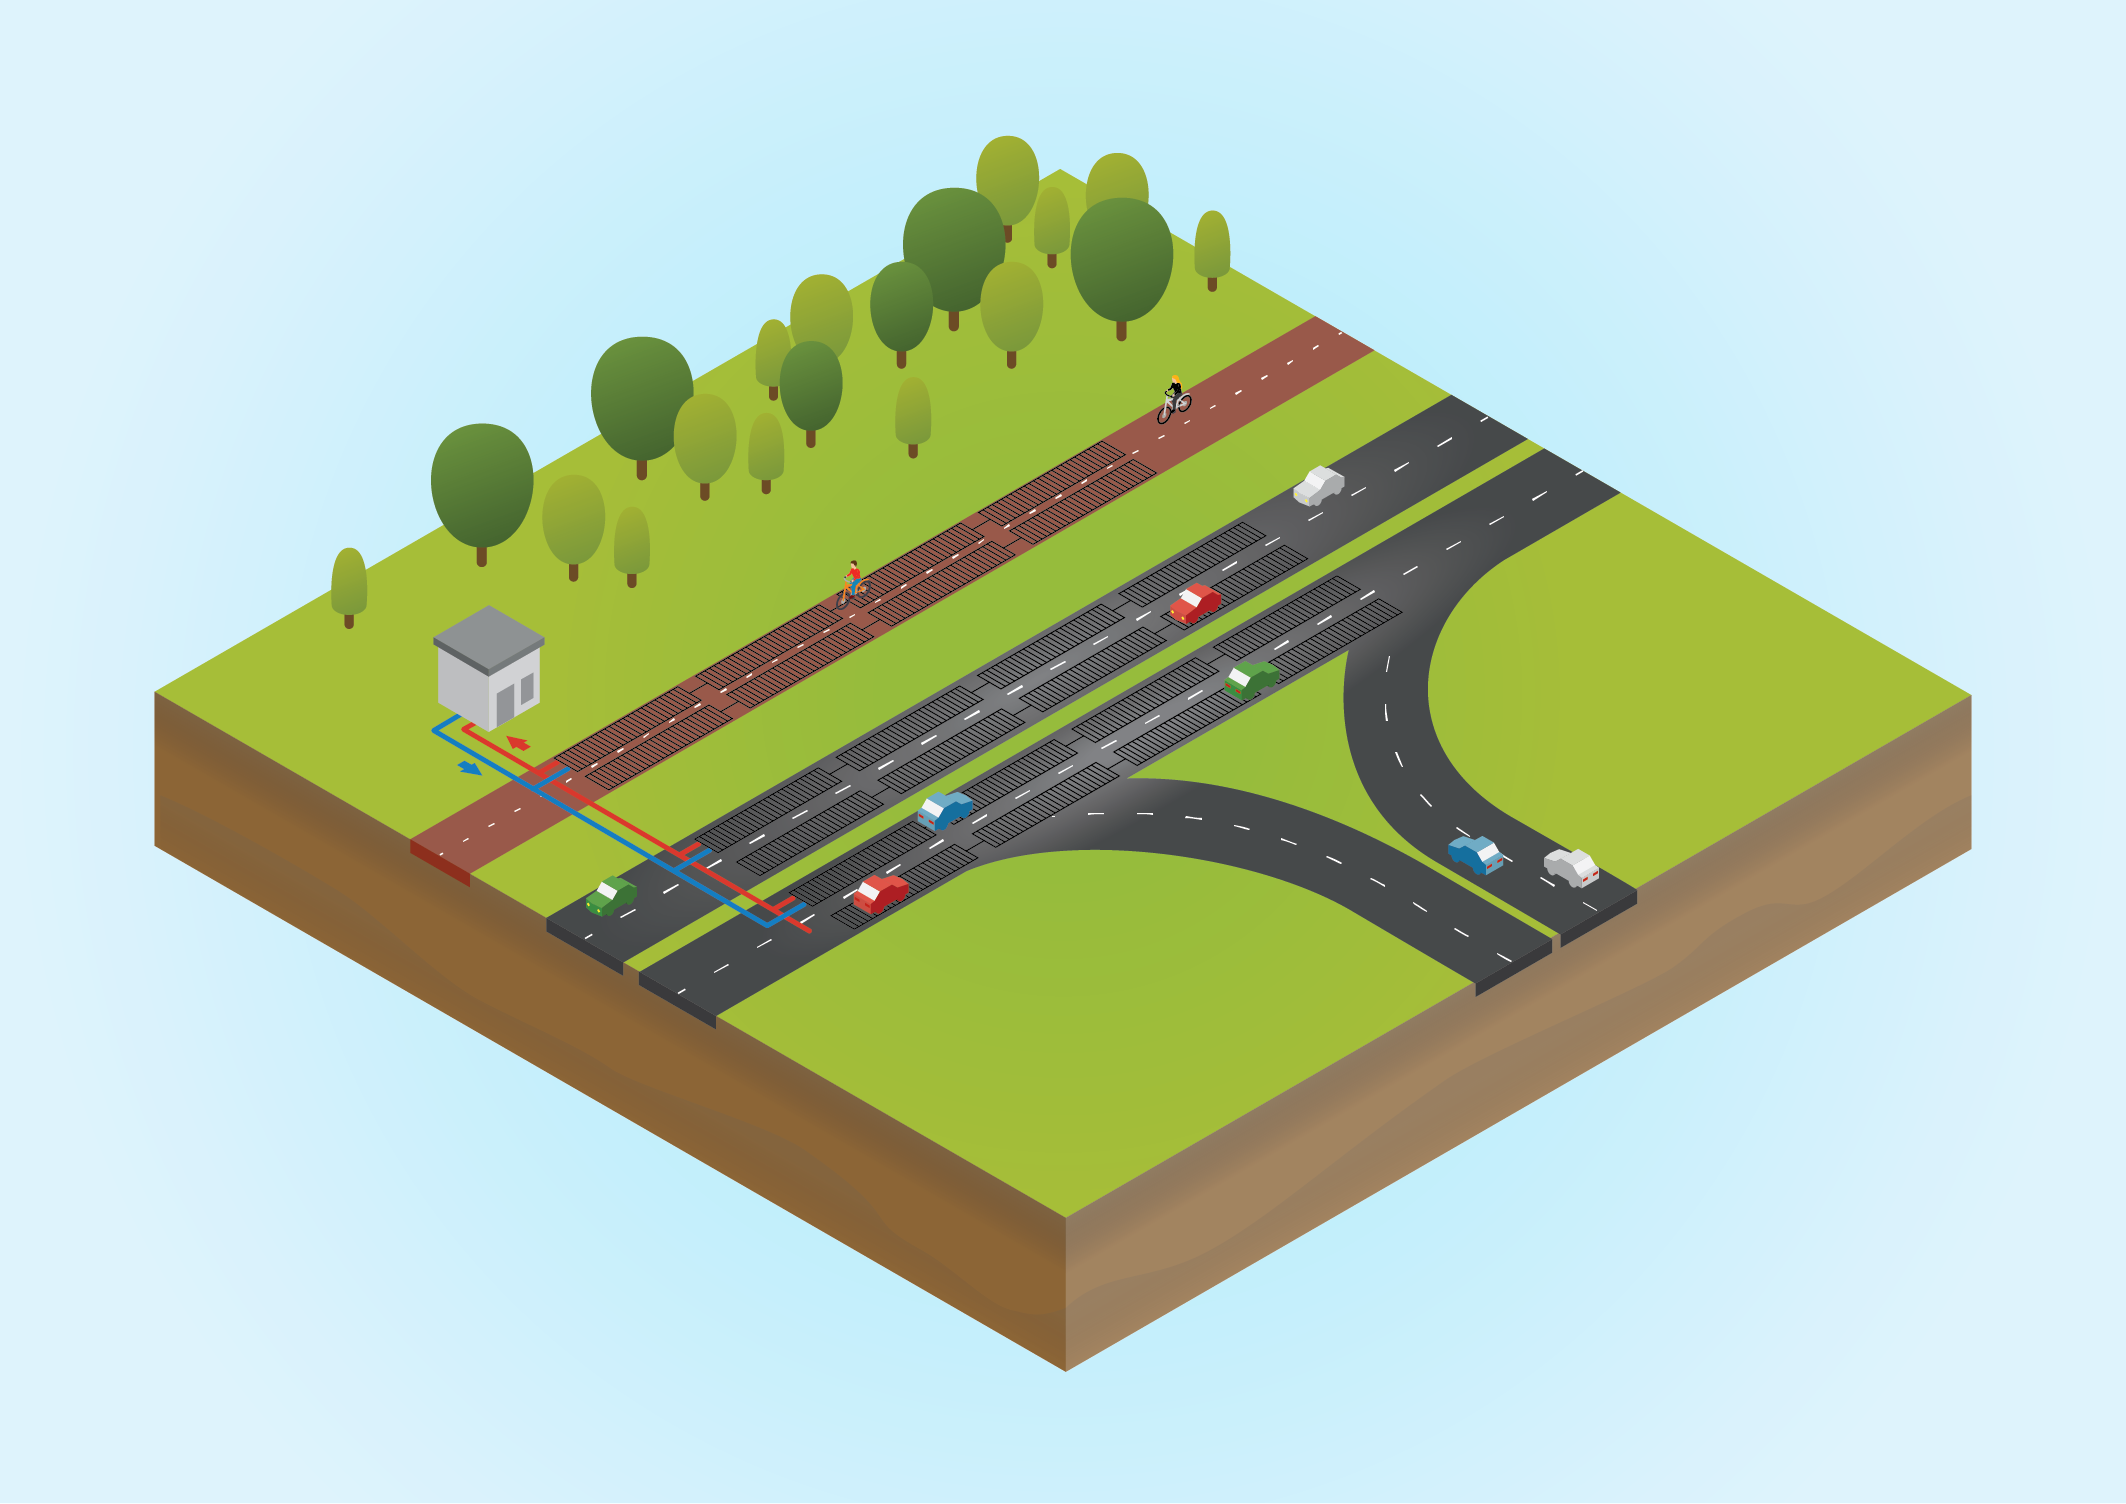
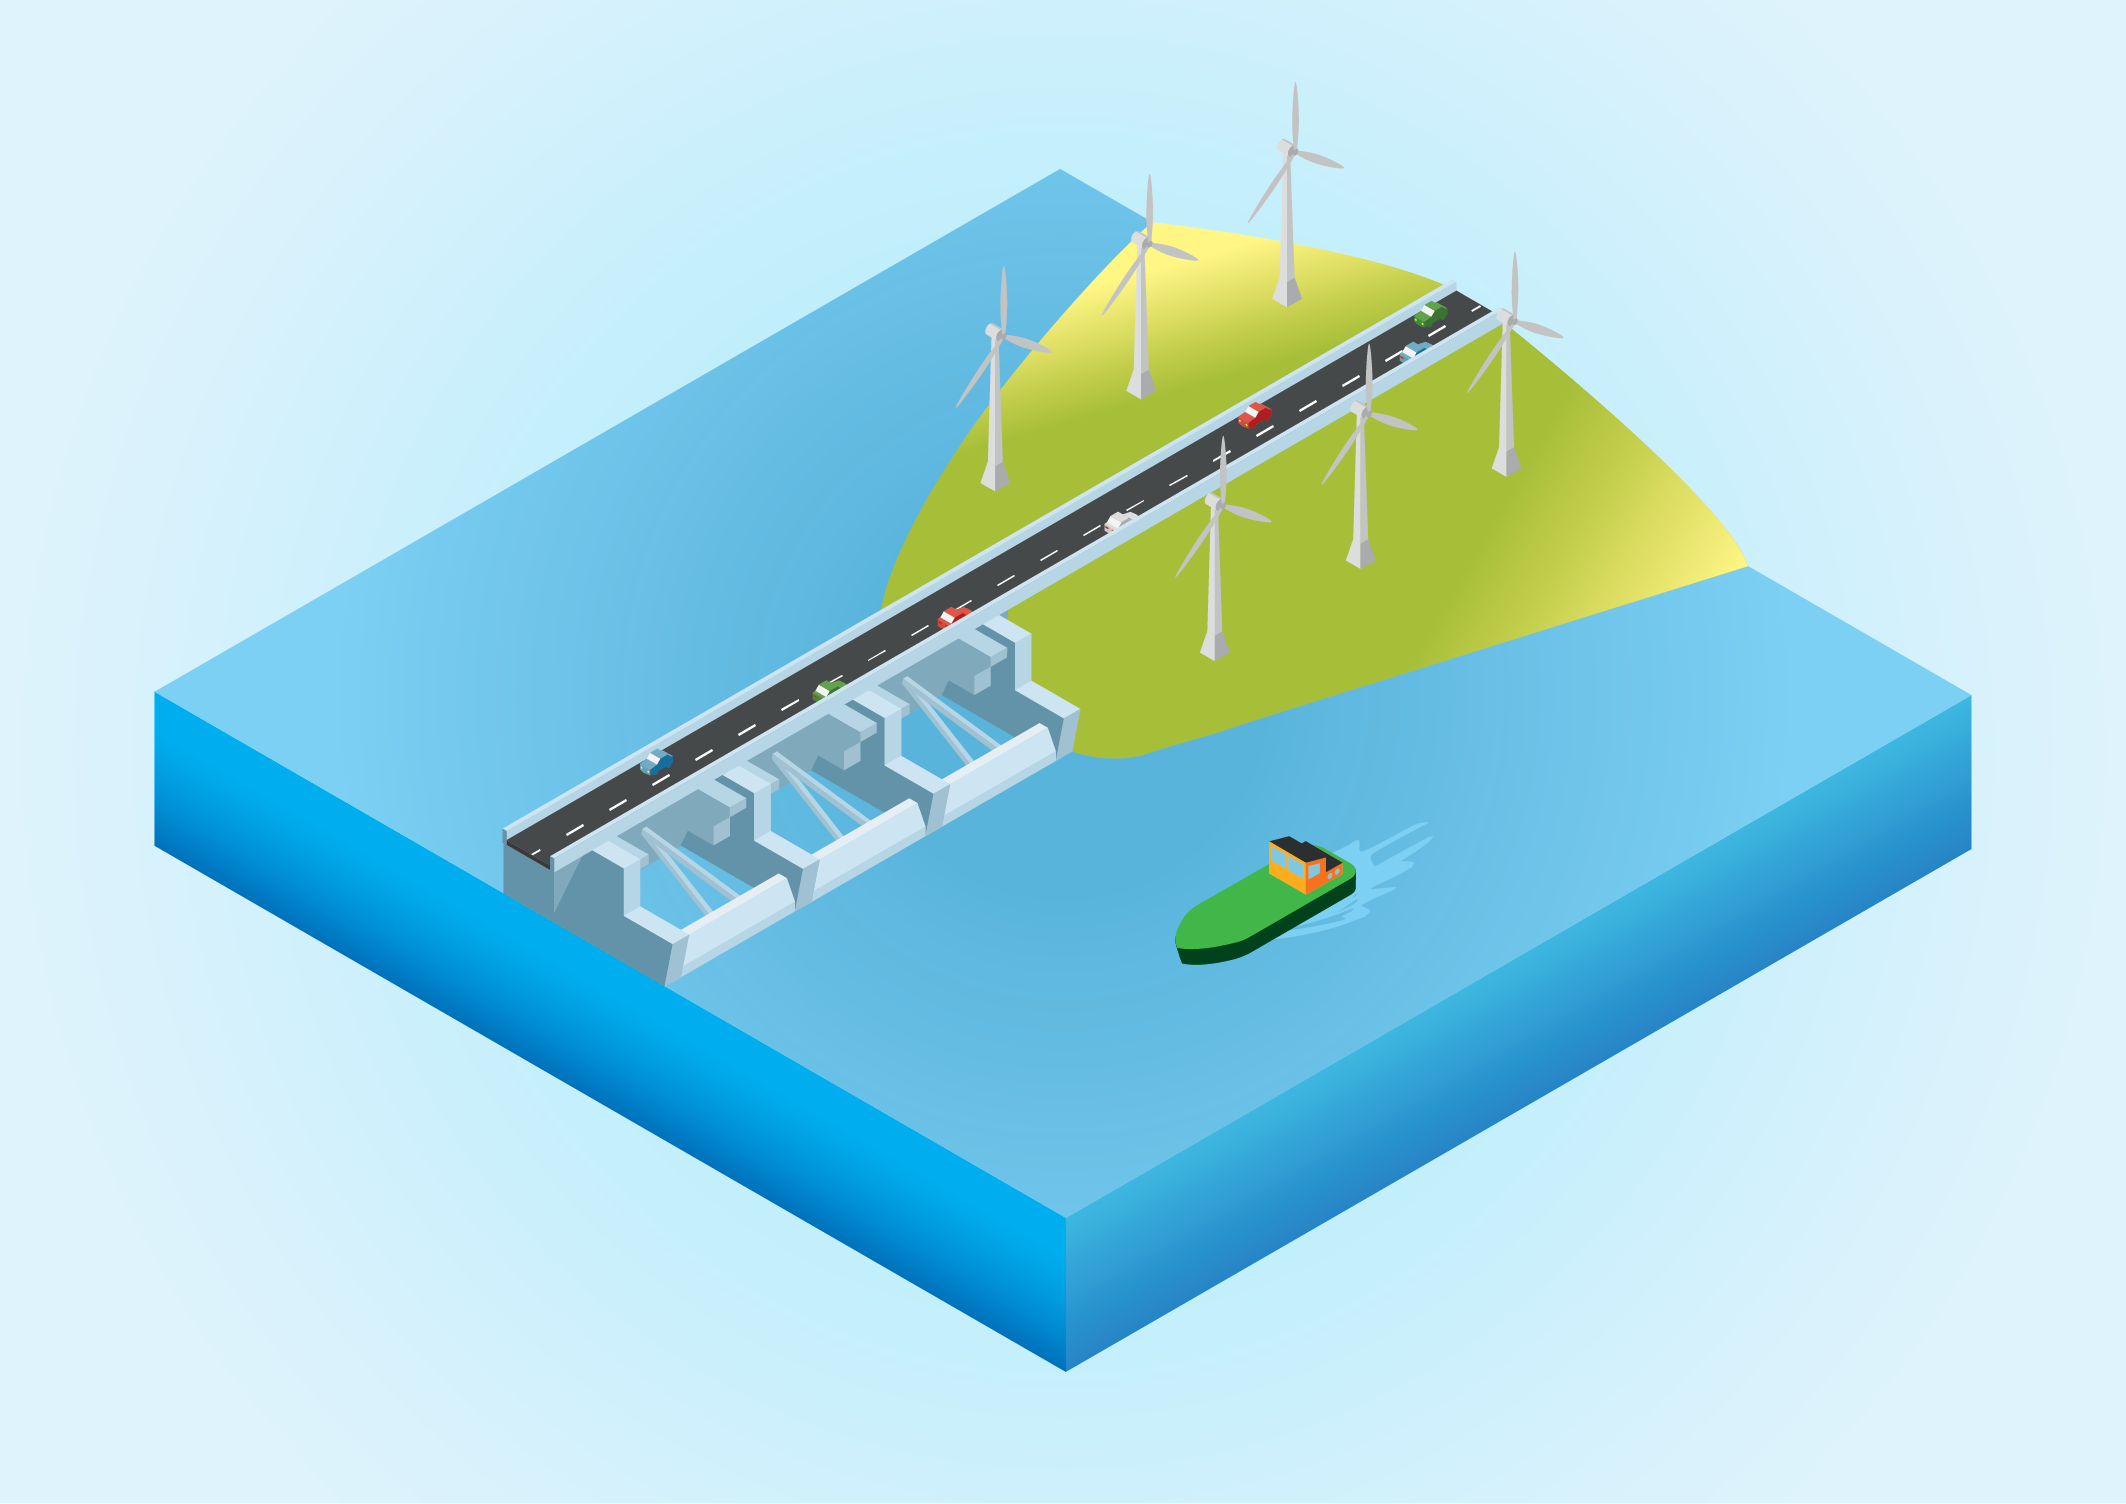
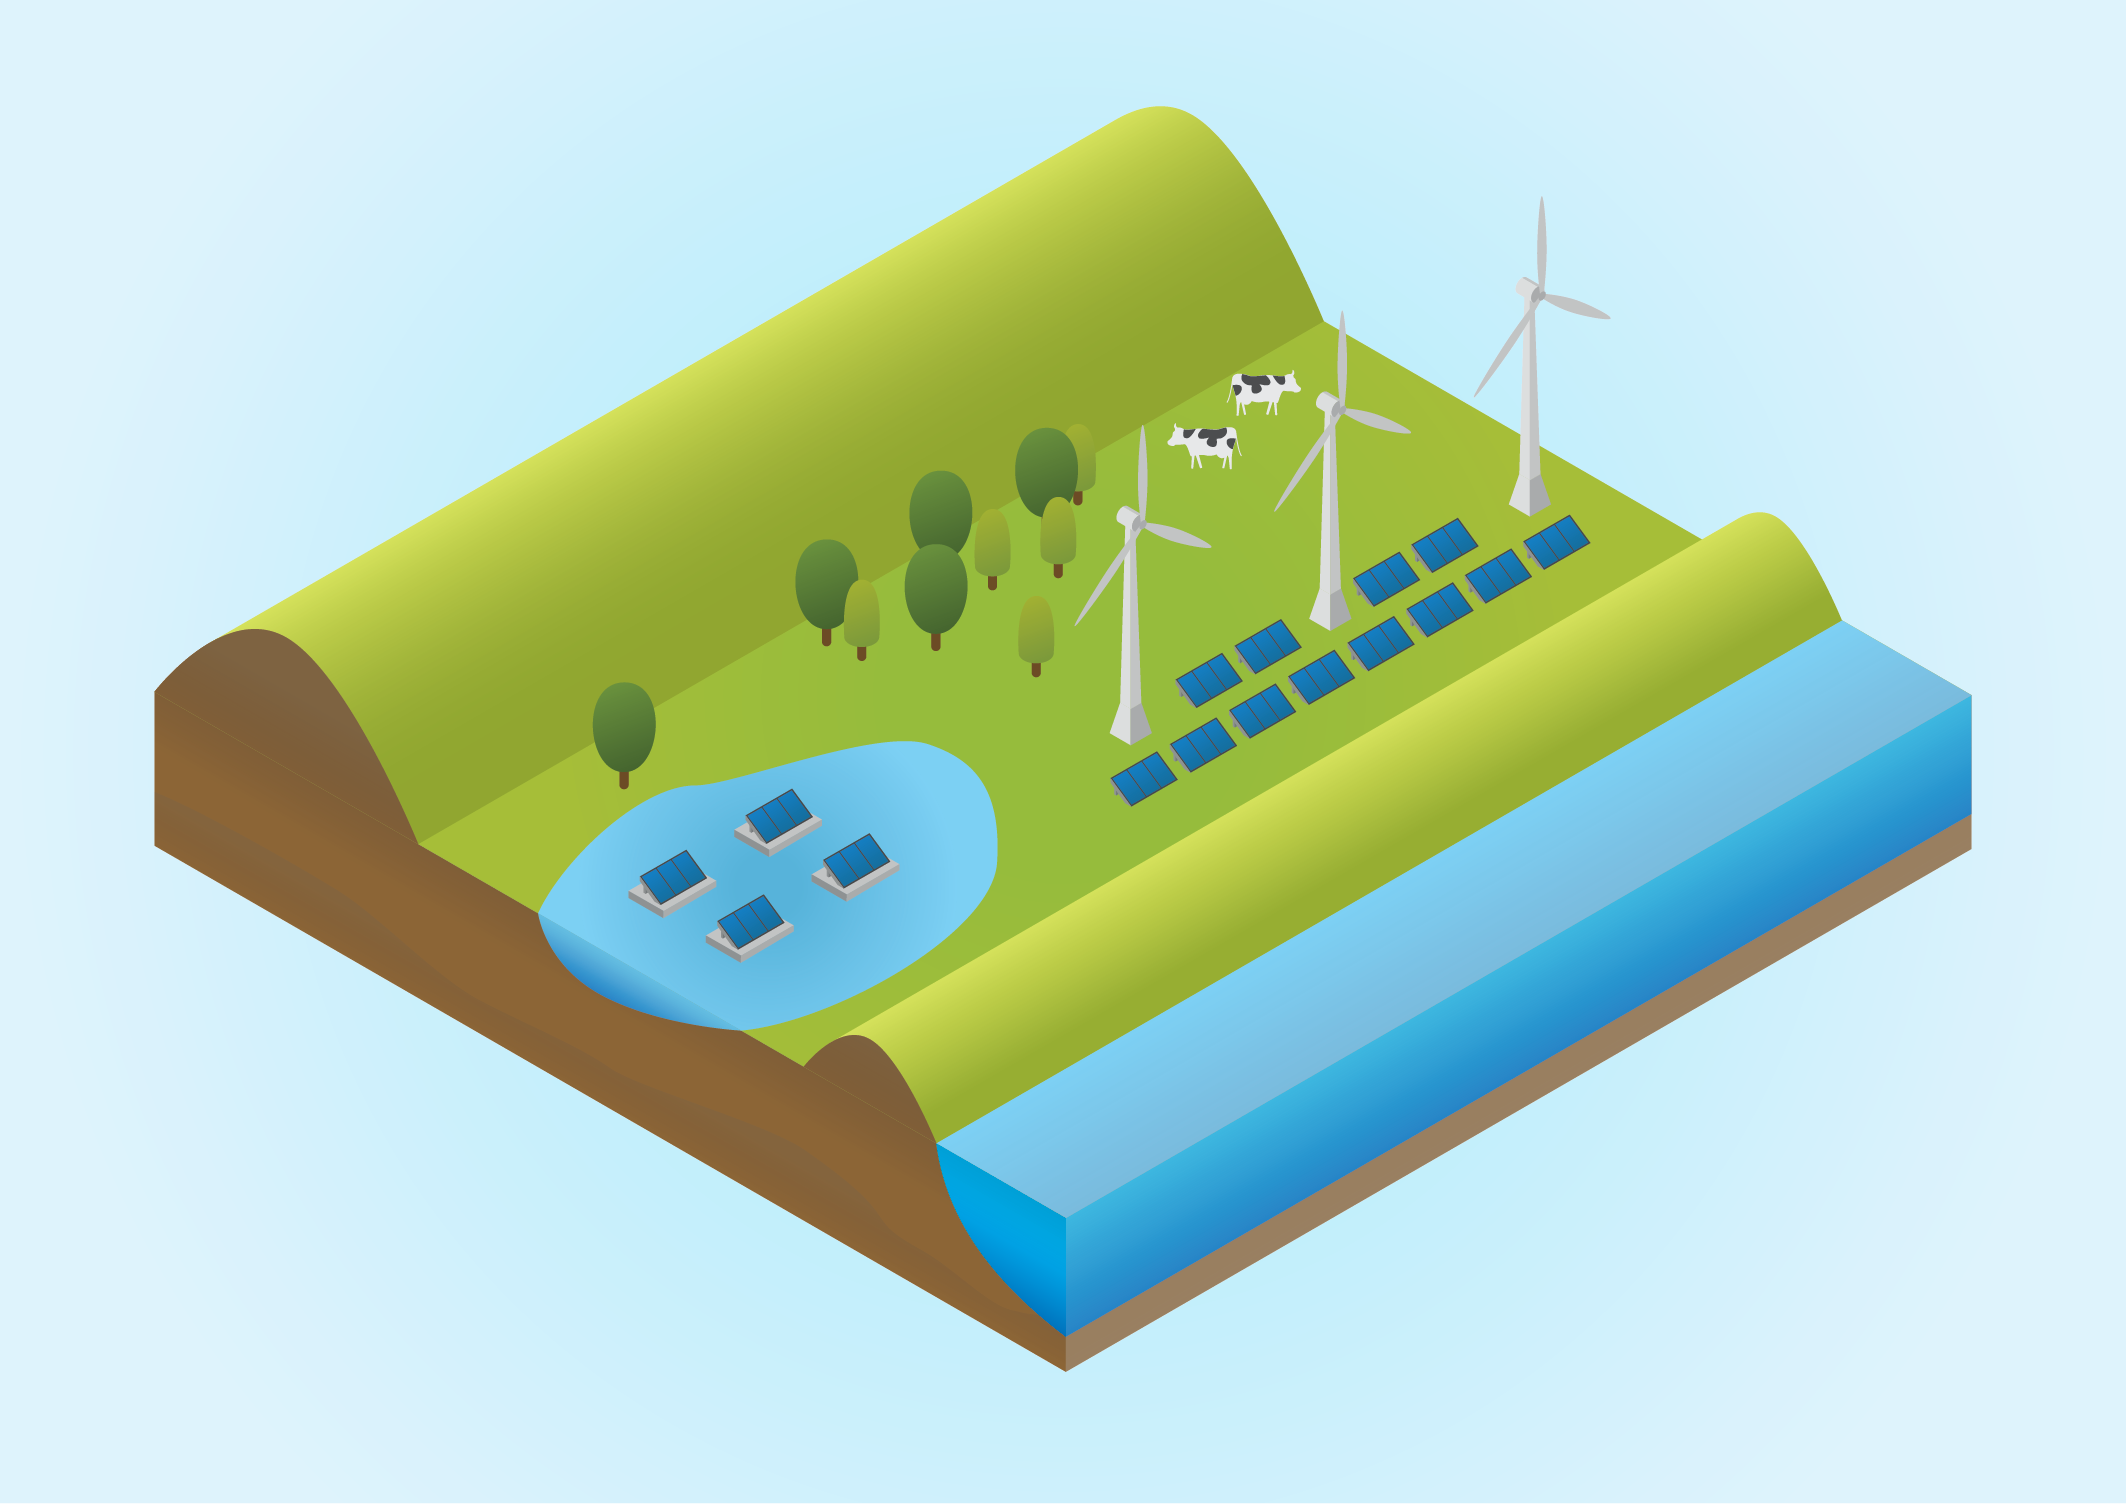

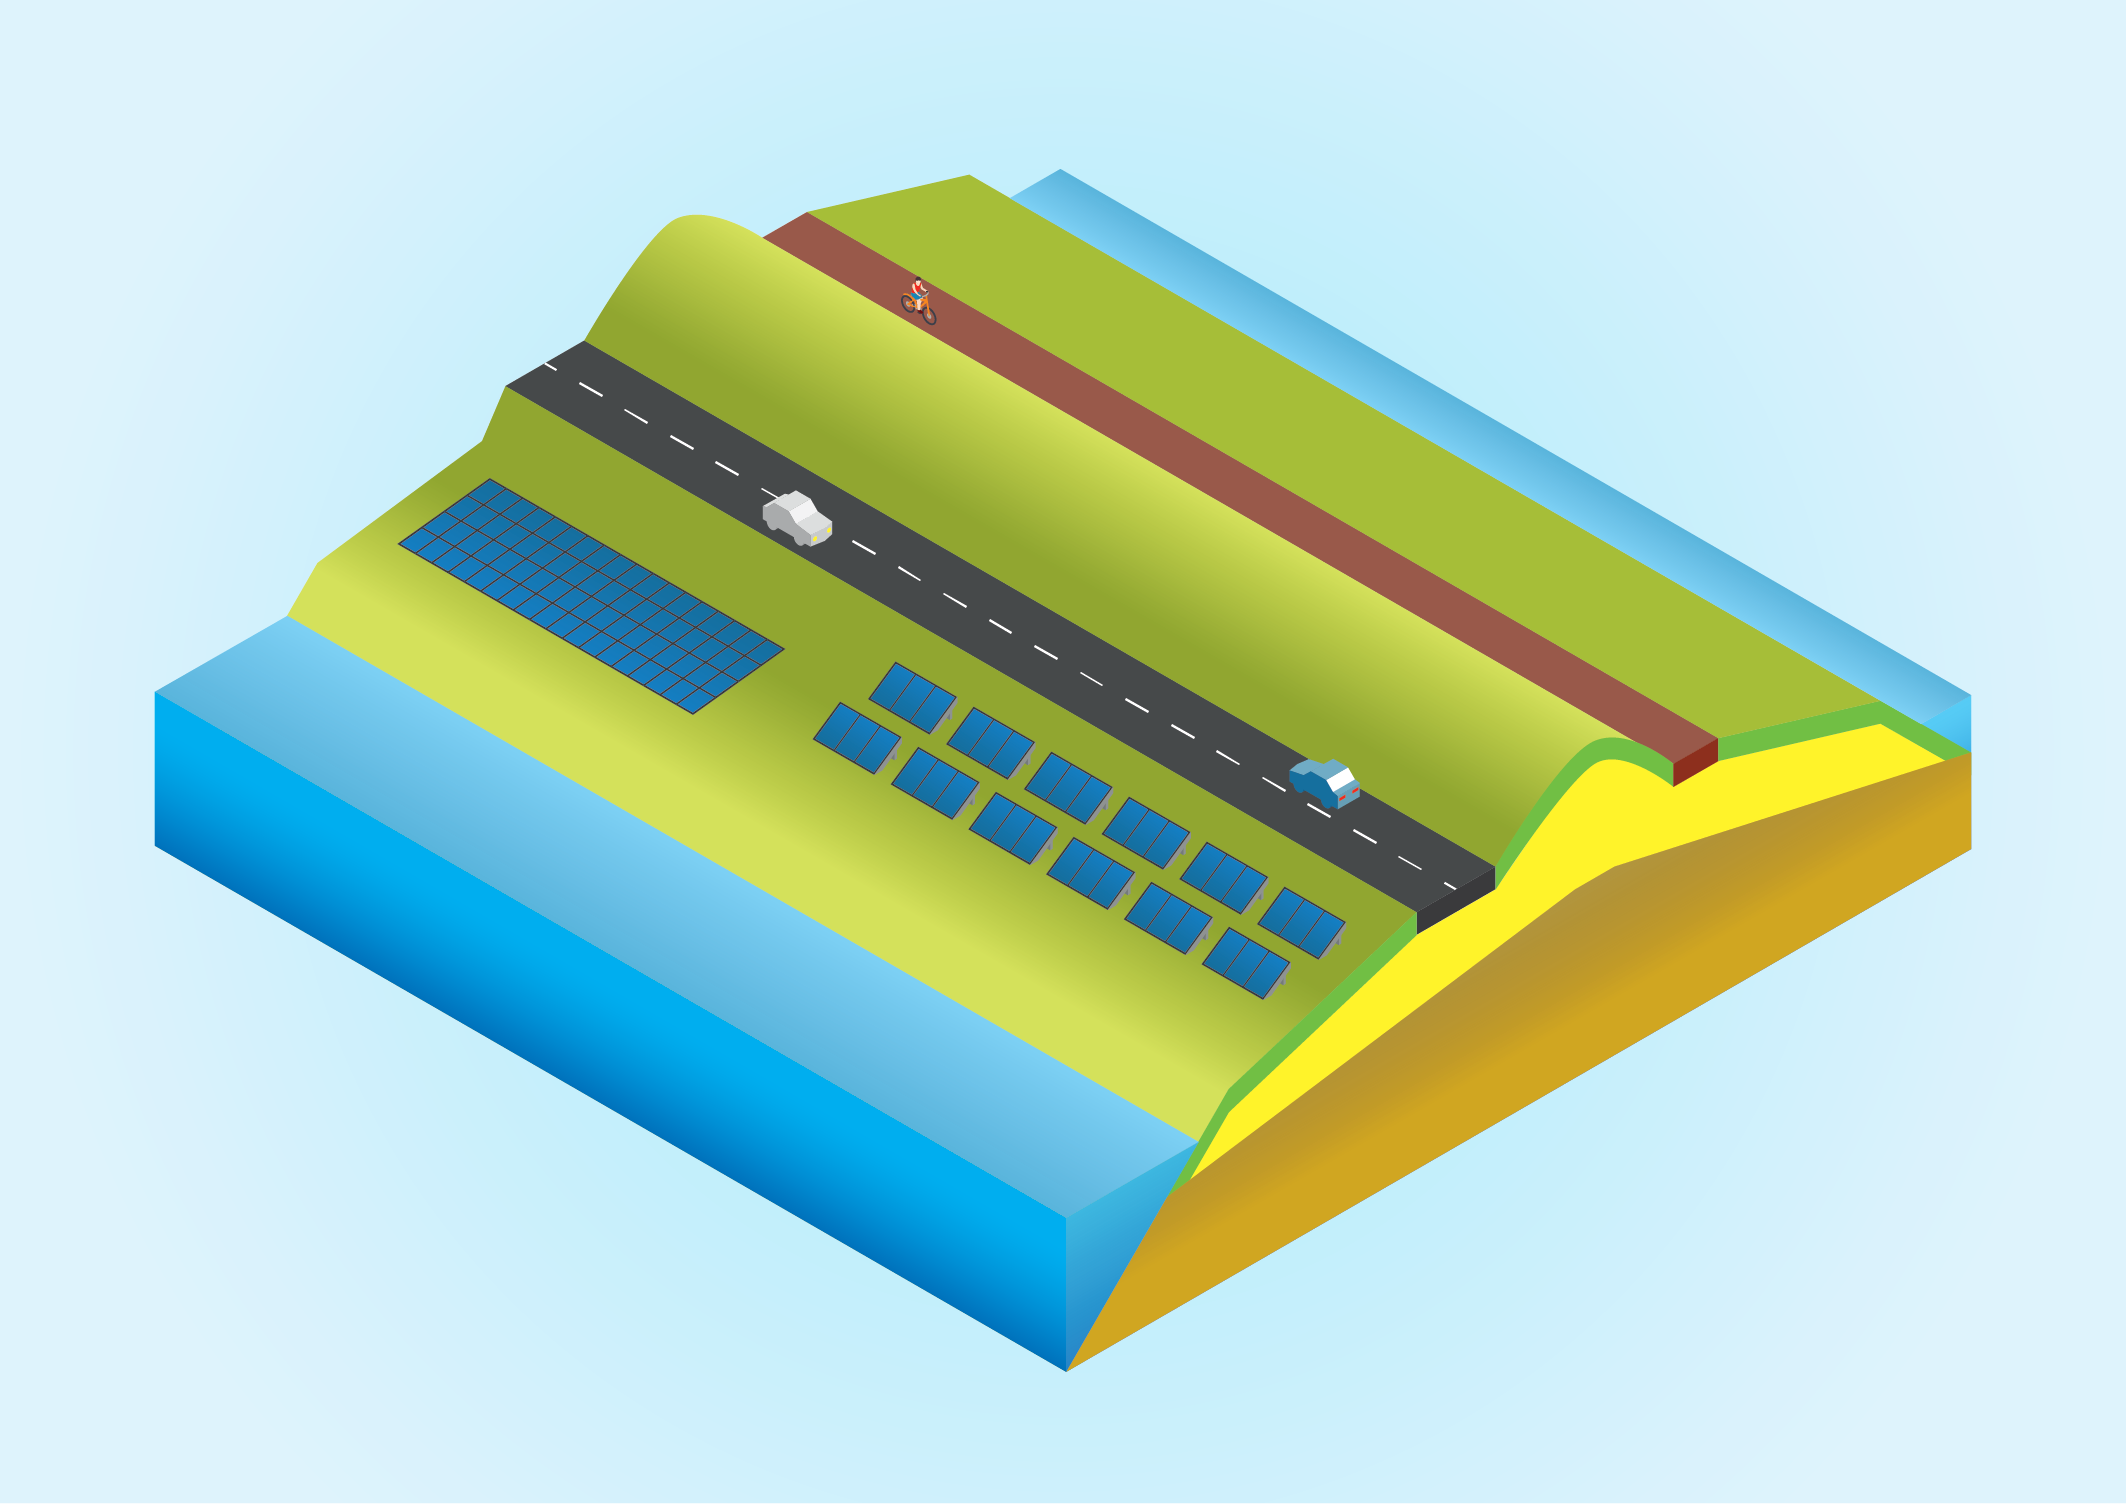

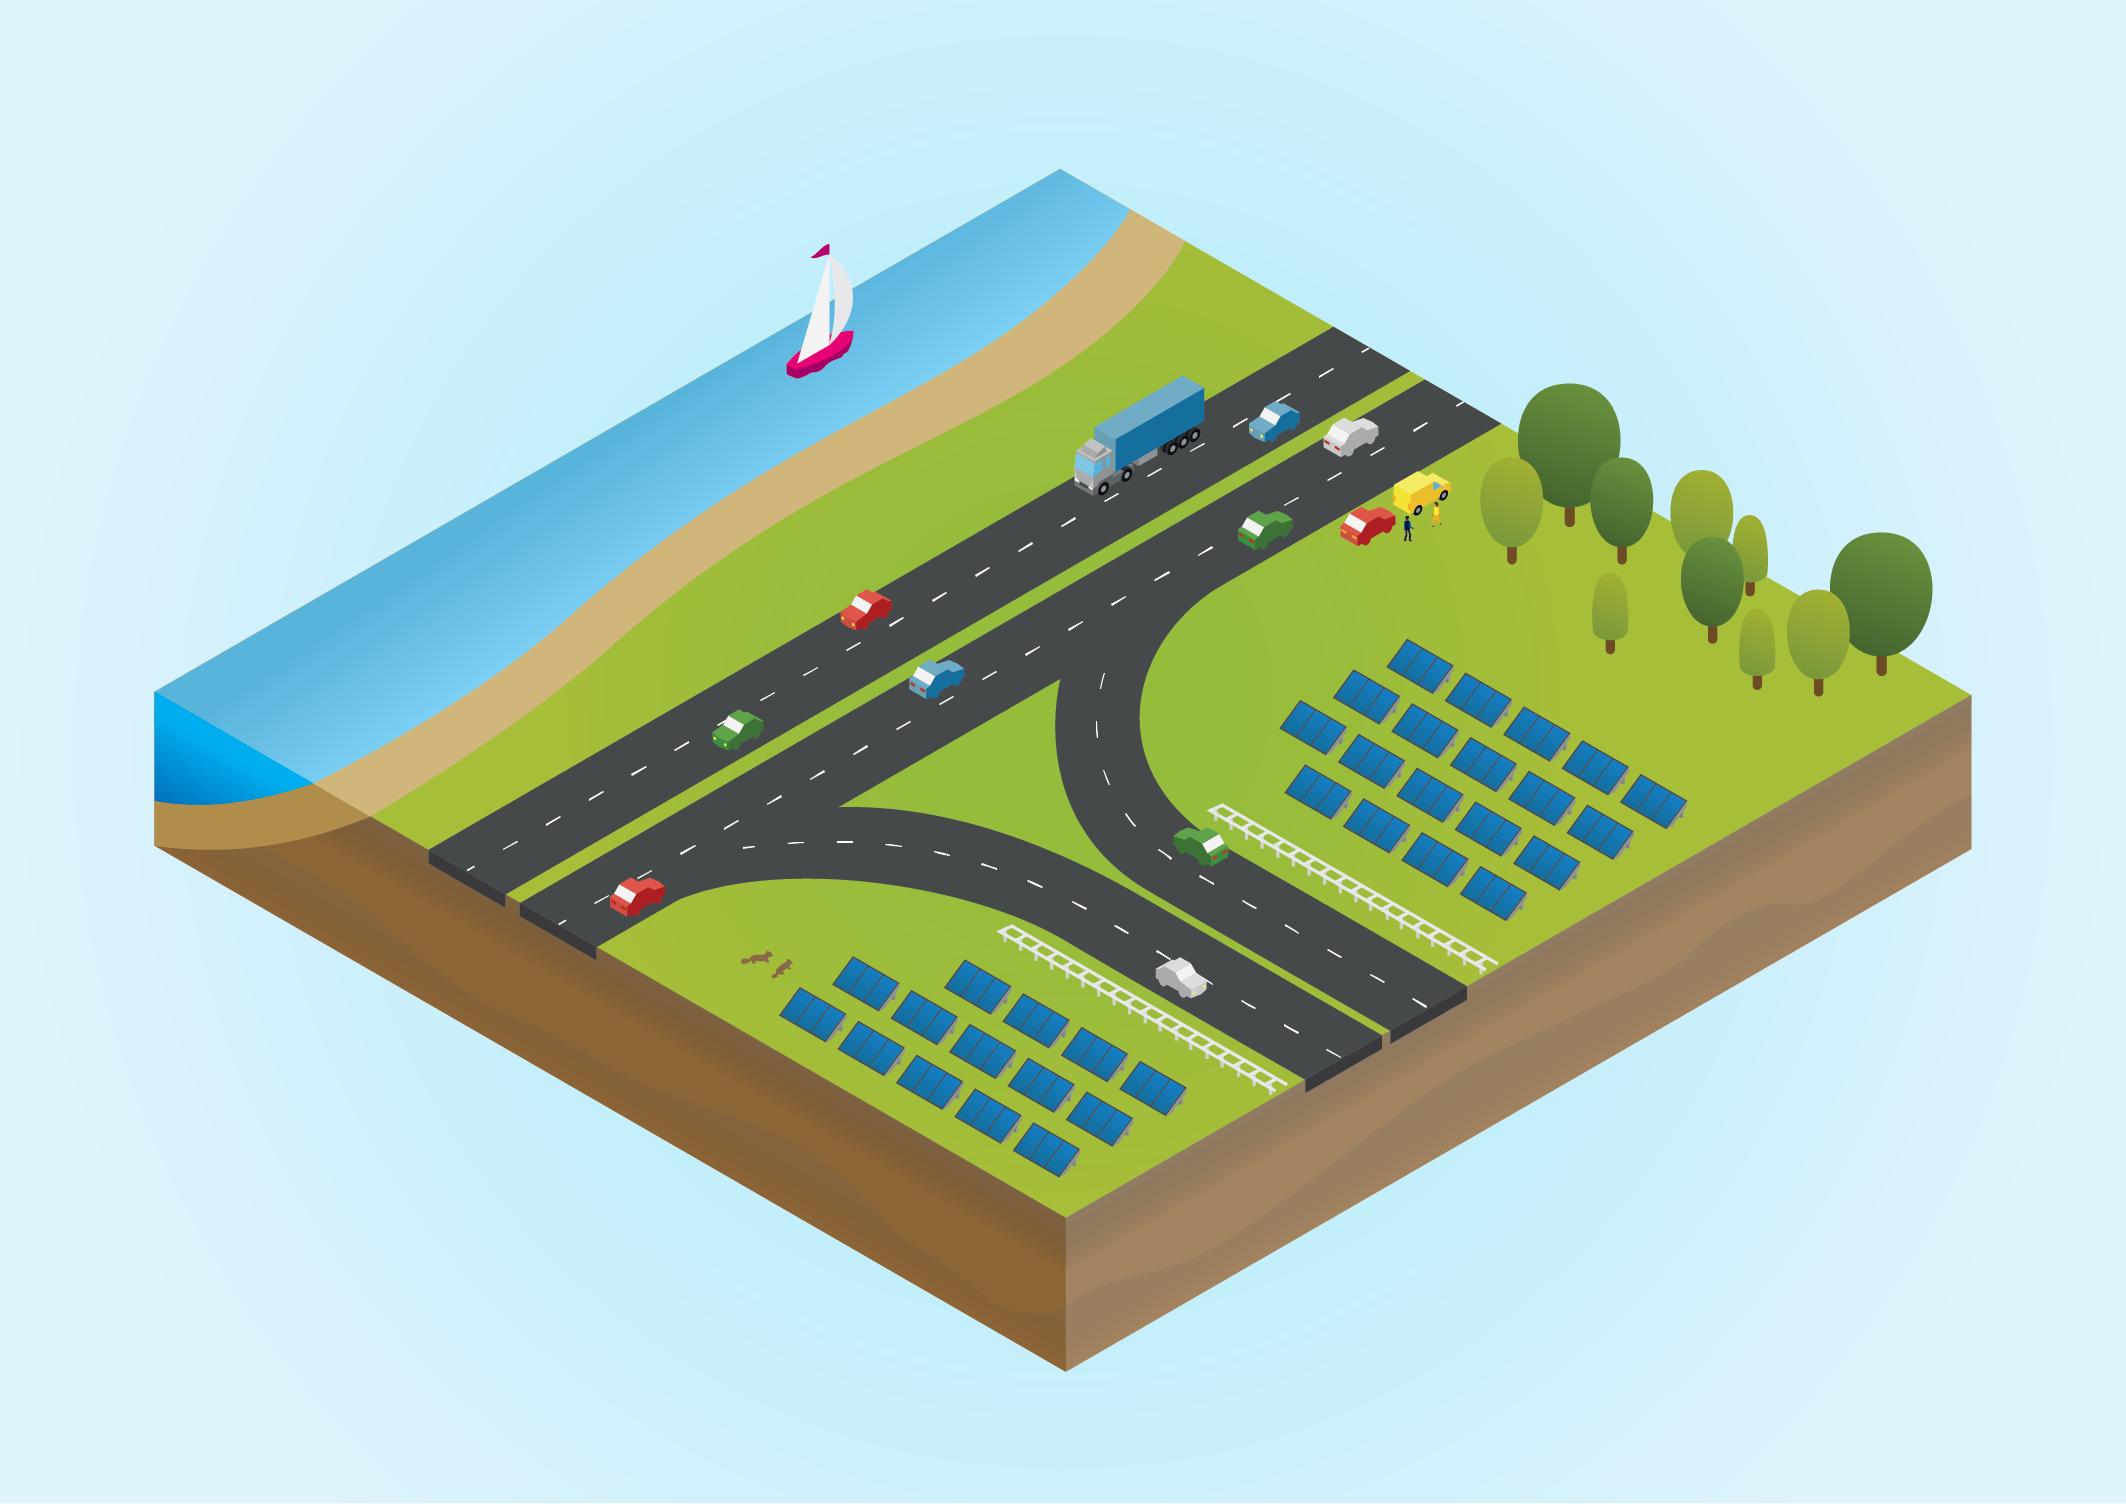
Regional Energy Strategy
Various agreements have been made to reduce 50% CO2 emissions in the Netherlands by 2030 compared to 1990. One of the agreements is to investigate where and how sustainable electricity best can be generated on land and water. The National Program Regional Energy Strategy (RES) provides support by developing and sharing knowledge and connecting different parties.
There's more!

Visuals the Netherlands after the crisis

Multiple infographics

Typeface Juna
Your project here? Contact me!
Copyright © Jolien Verduijn 2024